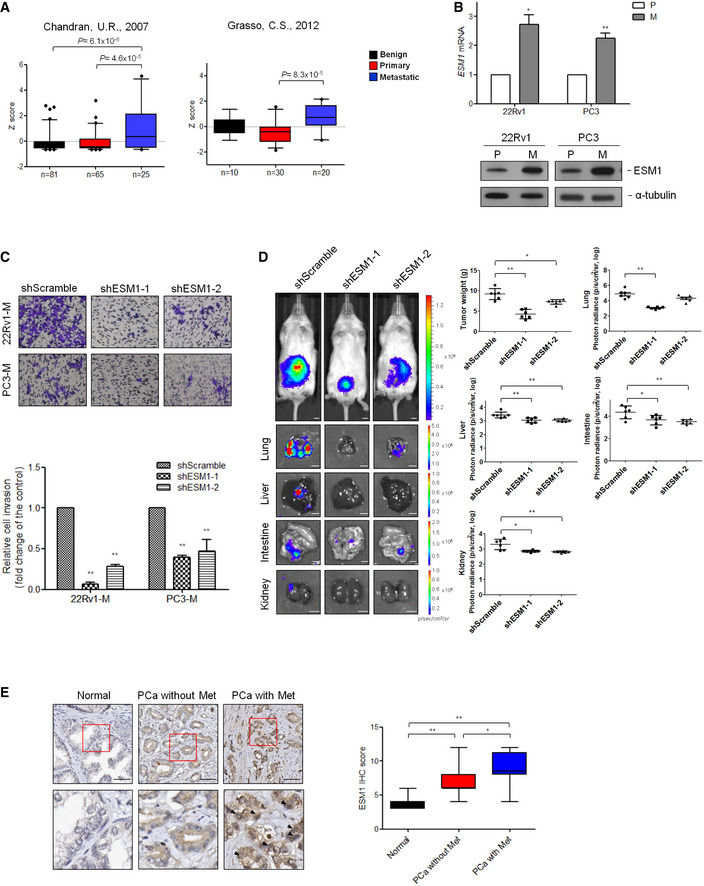
Figure 1. ESM1 is required for the process of metastasis in PCa.

- Graph derived from two published data available in the PubMed GEO database (GSE6919 and GSE35988). The box charts depict the relative expression of ESM1 in benign, primary, and metastatic prostate cancer patients. The center line donates the median value while the box contains the 25th–75th percentiles of dataset. The whiskers mark the 5th and 95th percentiles, and values beyond these upper and lower bounds are considered outliers. P‐value was obtained by two‐tailed Student’s t‐test.
- Relative ESM1 mRNA expression and ESM1 protein expression in two sets of human metastatic PCa cell lines. P: parental cells, M: metastatic cells.
- Cell invasion assays of 22Rv1‐M and PC3‐M cells transfected with either Scramble‐shRNA or ESM1‐shRNA. The data are shown as the relative fold change of invasive cells compared with the shScramble group. Scale bar: 100 μm.
- Representative images of lungs, livers, intestines, and kidneys from mice 8 weeks after orthotopical injection of 22Rv1‐M cells transfected with either Scramble‐shRNA or ESM1‐shRNA. Scale bar: 0.5 cm. Tumors were removed and weighed. Quantitative summary of tumor luminescence in different metastases measured in photons/second is shown.
- Formalin‐fixed, paraffin‐embedded tissue microarray sections of 59 normal prostate tissues, and 65 prostate adenocarcinoma tissues with and without metastasis (n = 16 and n = 49, respectively) were stained with an anti‐ESM1 antibody. Tissue‐bound ESM1 is shown in brown. Scale bar: 50 μm. Arrowheads indicate positively stained nucleus of cancer cells. Plot representation of scores according to immunohistochemical expression of ESM1 in normal prostate tissue related to the prostate adenocarcinoma tissue with and without metastasis. The scores are calculated by intensity (score 1–3) × percentage (score 1–4) of stained cells. The line in the middle of the box is plotted at the median. The box extends from the 25th to 75th percentiles. Whiskers above and below the box indicate the 5th and 95th percentiles. P‐value was obtained by two‐tailed Student’s t‐test.
Data information: Differences in (B) and (C) are shown as fold change compared with control cells presented as the mean ± SD of three independent experiments. *P < 0.05, **P < 0.01 when compared to control group by two‐tailed Student’s t‐test. Source data are available online for this figure.
