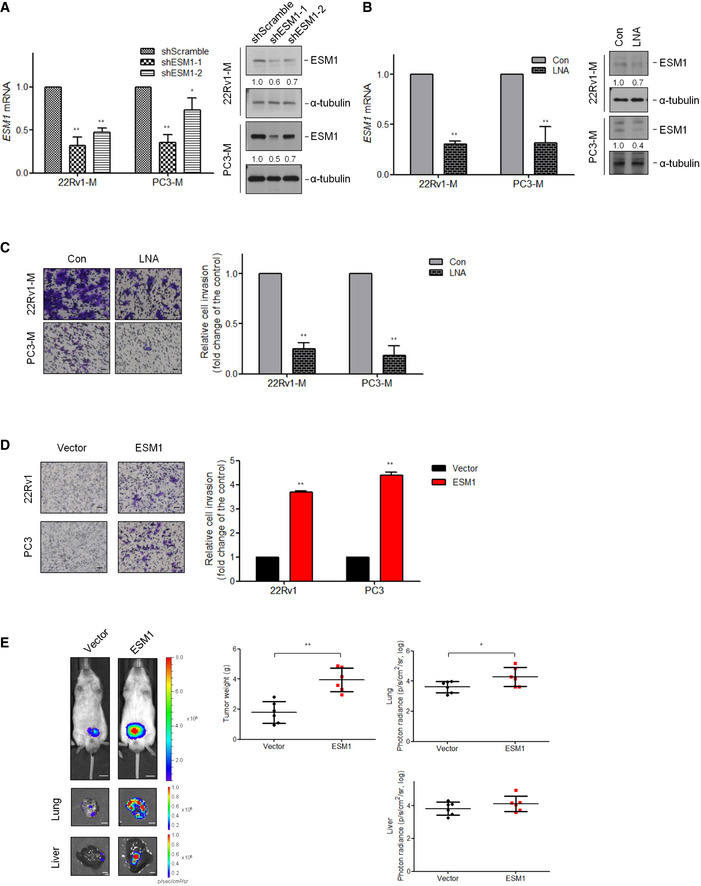
Figure EV1. Manipulating ESM1 expression is correlated with cell invasion and tumor metastasis (related to Fig 2).

- Relative ESM1 mRNA expression (left) and ESM1 protein expression (right) in human metastatic PCa cell lines‐22Rv1‐M and PC3‐M transfected with either Scramble‐shRNA or ESM1‐shRNA. Differences in mRNA levels compared with shScramble cells are shown as fold changes presented as the mean ± SD of three independent experiments. *P < 0.05, **P < 0.01 when compared to shScramble cells by two‐tailed Student’s t‐test. The normalized signal intensity of the target band is shown below the blots as fold changes compared with shScramble group.
- Relative ESM1 mRNA expression (left) and ESM1 protein expression (right) in human metastatic PCa cells treated with either control or ESM1‐locked nucleic acid (LNA). Bars are the mean ± SD of three independent experiments. **P < 0.01 when compared to control group by two‐tailed Student’s t‐test. The normalized signal intensity of the target band is shown below the blots as fold changes compared with control group.
- Left, representative views of cells in the Transwell invasion assay. Scale bar: 100 μm. Right, quantification of cells that invaded through a Matrigel‐coated membrane following treatment with control or ESM1‐LNA. Bars are the mean ± SD of three independent experiments. **P < 0.01 when compared to control group by two‐tailed Student’s t‐test.
- Left, representative views of cells in the Transwell invasion assay. Scale bar: 100 μm. Right, statistical data regarding invasive ability of ESM1‐overexpressing cells. Bars are the mean ± SD of three independent experiments. **P < 0.01 when compared to vector cells by two‐tailed Student’s t‐test.
- Representative images of lungs and livers from mice 8 weeks after orthotopical injection of 22Rv1‐P cells transfected with either vector control or ESM1. Scale bar: 0.5 cm. Tumors were removed and weighed. Quantitative summary of tumor luminescence in photons per second of different metastases. *P < 0.05, **P < 0.01 when compared to vector cells by two‐tailed Student’s t‐test and error bars represent the standard deviation of six independent experiments.
Source data are available online for this figure.
