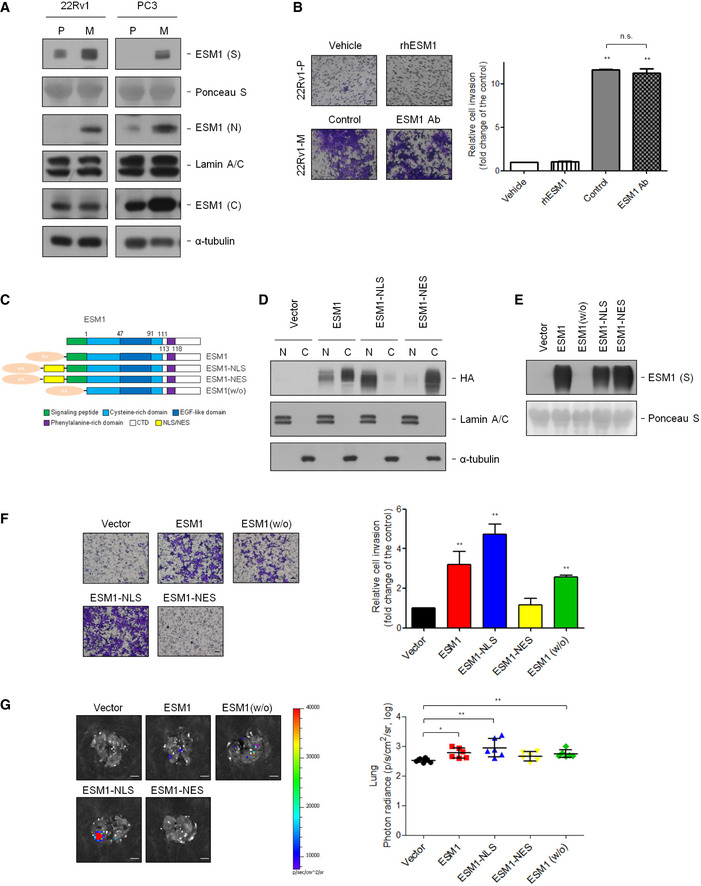
Figure 2. Nuclear ESM1, instead of secreted ESM1, promotes PCa invasion.

- Immunoblotting analysis of ESM1 in supernatant (S), nucleus (N), and cytoplasm (C) was performed. Ponceau S, Lamin A/C, and α‐tubulin were used as loading control in supernatant, nucleus, and cytoplasm, respectively. P: parental cells, M: metastatic cells.
- Left, representative images of cells in the Transwell invasion assay. Right, quantification of cells that invaded through the Matrigel‐coated membrane following treatment with PBS or human recombinant ESM1 (rhESM1) or normal goat IgG control or anti‐ESM1 neutralizing antibody. Scale bar: 100 μm.
- Schematic diagram of ESM1 expression constructs.
- Elicitation of ESM1 overexpression using HA‐tag antibody results in detectable ESM1 expression in the nucleus and cytoplasm of 22Rv1‐P cells. Lamin A/C and α‐tubulin were used as loading control in the nucleus and cytoplasm, respectively.
- Immunoblotting of ESM1 expression with different expressing patterns in the supernatant (S) of 22Rv1‐P cells.
- Left, representative images of 22Rv1‐P cells in the Transwell invasion assay. Right, statistic data of invasive ability of ESM1‐expressing cells. Scale bar: 100 μm.
- Left, representative bioluminescence images of lung metastasis in mice after tail vein injection of 22Rv1‐Luc cells with different ESM1 expression patterns. Scale bar: 0.5 cm. Right, quantification of the lung bioluminescence by photons/ seconds.
Data information: Differences are shown compared with control cells presented as the mean ± SD of three independent experiments. *P < 0.05, **P < 0.01 when compared to control group by two‐tailed Student’s t‐test. Source data are available online for this figure.
