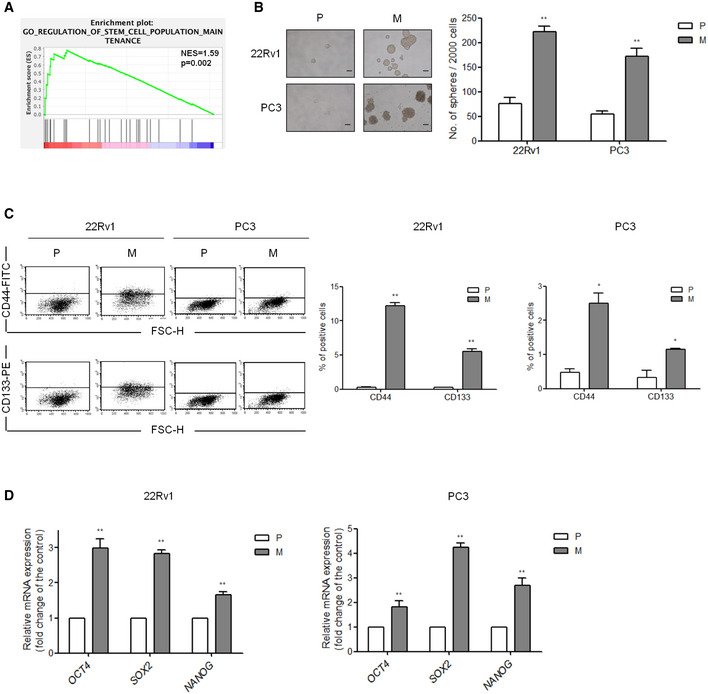
GSEA demonstrating the enrichment of gene sets related to “regulation of stem cell population maintenance” signatures in the ranked gene list of ESM1‐high vs. ESM1‐low PCa patients from the TCGA database. NES, normalized enrichment score. The P‐values for the GSEA test statistics are calculated by permutation. The original test statistics for the features are permuted, and new test statistics are calculated for each category, based on the permuted feature test statistics.
Spheroid formation in 22Rv1‐P, 22Rv1‐M, PC3‐P, and PC3‐M cells. P: parental cells, M: metastatic cells. Left, spheroids formed by these four cell lines. Scale bar: 100 μm. Right, total number of spheroid cells was calculated at day 7 in PC3‐P and PC3‐M cells and at day 14 in 22Rv1‐P and 22Rv1‐M cells were calculated. Quantitative data comparing the average number of spheres formed are presented as the mean ± SD of three independent experiments. **P < 0.01 when compared to parental cells by two‐tailed Student’s t‐test.
Flow cytometry analysis of the ratio of CD44+ and CD133+ cells in 22Rv1‐P/22Rv1‐M and PC3‐P/PC3‐M pairs. Multiples of difference compared with parental cells are presented as the mean ± SD of three independent experiments. *P < 0.05, **P < 0.01 when compared to parental cells by two‐tailed Student’s t‐test.
mRNA expression of PCa stem cell markers, Oct4, Sox2, and Nanog in two sets of human metastatic PCa cell lines. Left, statistical analysis of CSC markers in 22Rv1‐P/22Rv1‐M pairs. Right, statistical analysis of CSC markers in PC3‐P/PC3‐M pairs. Differences in mRNA levels compared with parental cells are shown as fold changes presented as the mean ± SD of three independent experiments. *P < 0.05, **P < 0.01 when compared to parental cells by two‐tailed Student’s t‐test.

