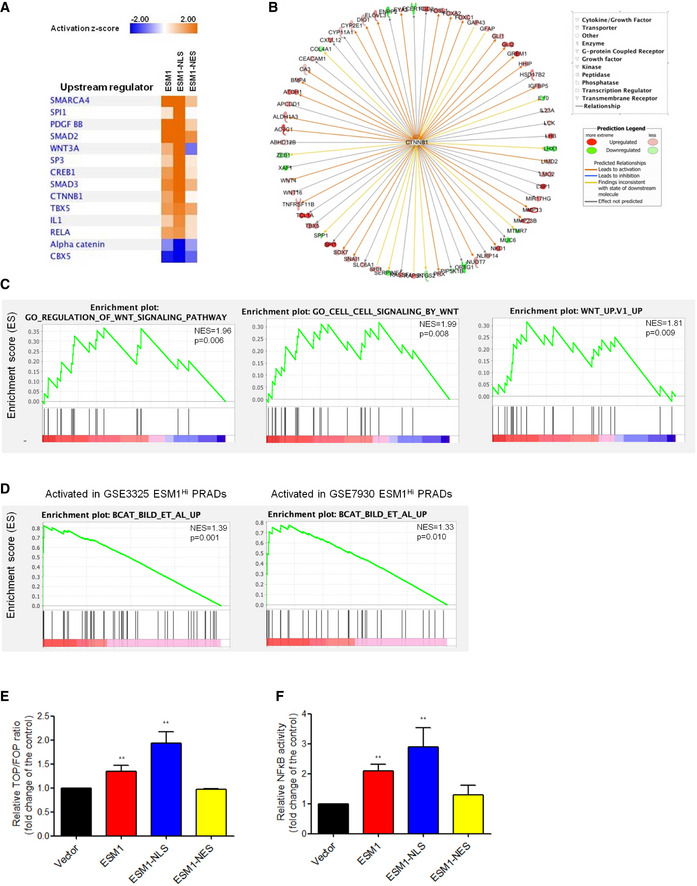
Figure 4. Nuclear ESM1 drives PCa metastasis through β‐catenin and NFκB signaling pathway.

- IPA analysis of RNA‐seq data showing the 14 top‐predicted upstream regulators of differentially expressed genes. Positive Z‐scores (orange) represent activated upstream regulators, and negative Z‐scores (blue) represent inhibited upstream regulators.
- Known regulators of differentially expressed genes in the ESM1‐NLS cells giving rise to the prediction of CTNNB1 as an upstream regulator. Observed upregulation and downregulation of mRNA are shown in red and green, respectively. The predicted relationships were shown as arrow lines with different colors. The detail of predicted relationships of all the genes to the upstream regulator and the color intensity scale was described in the prediction legend.
- GSEA of RNA‐seq data demonstrating the enrichment of gene sets related to Wnt signaling in 22Rv1‐P cells expressing ESM1‐NLS. NES, normalized enrichment score. The p‐values for the GSEA test statistics are calculated by permutation. The original test statistics for the features are permuted, and new test statistics are calculated for each category, based on the permuted feature test statistics.
- GSEA analysis identified β‐catenin oncogenic signatures as the top induced pathways of PRAD in the PubMed GEO datasets (GSE3325 and GSE7930). NES, normalized enrichment score. The p‐values for the GSEA test statistics are calculated by permutation. The original test statistics for the features are permuted, and new test statistics are calculated for each category, based on the permuted feature test statistics.
- The transcriptional activity of β‐catenin in 22Rv1‐P cells with different patterns of ESM1 overexpression. Bars are the mean ± SD of three independent experiments.
- Manipulating ESM1 expression impacts transcriptional activity of NFκB. Bars are the mean ± SD of three independent experiments.
Data information: β‐catenin and NFκB promoter reporter activity were normalized by comparison with Renilla luciferase activity. **P < 0.01 when compared to vector cells by two‐tailed Student’s t‐test.
