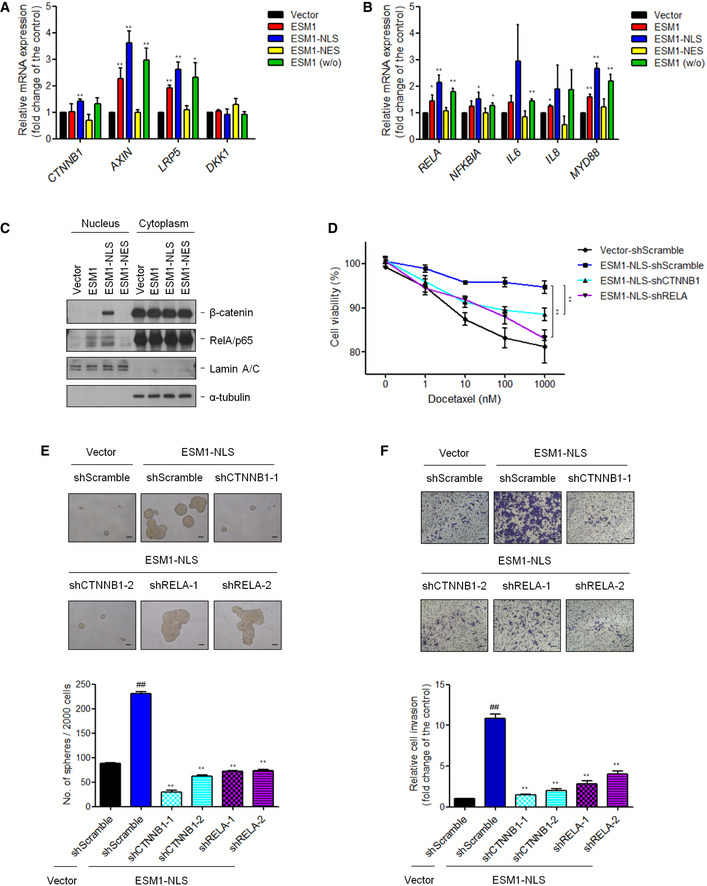
Figure 5. Nuclear ESM1 promotes PCa stemness through β‐catenin signaling pathway.

- qRT–PCR analysis of the mRNA levels of the genes related to β‐catenin downstream signaling pathway. Differences in mRNA levels compared with vector cells are shown as fold changes presented as the mean ± SD of three independent experiments. *P < 0.05, **P < 0.01 when compared to vector cells by two‐tailed Student’s t‐test.
- qRT–PCR analysis of the mRNA levels of NFκB targeting genes. Differences in mRNA levels compared with vector cells are shown as fold changes presented as the mean ± SD of three independent experiments. *P < 0.05, **P < 0.01 when compared to vector cells by two‐tailed Student’s t‐test.
- Immunoblotting analysis of 22Rv1‐P cells with different ESM1 overexpression in the nucleus and cytoplasm was performed with the antibodies indicated.
- Suppression of β‐catenin or NFκB in 22Rv1‐P cells stably expressing ESM1‐NLS was treated with docetaxel at the indicated concentrations for 48 h. **P < 0.01 when compared to vector‐shScramble cells by two‐tailed Student’s t‐test and error bars represent the standard deviation of three independent experiments.
- Tumorspheres formed by 22Rv1‐P cells stably expressing ESM1‐NLS with either β‐catenin or NFκB shRNAs. Scale bar: 100 μm. Bars are the mean ± SD of three independent experiments. ## P < 0.01 when compared to vector‐shScramble cells, **P < 0.01 when compared to ESM1‐NLS‐shScramble cells by two‐tailed Student’s t‐test.
- Representative images and quantitative data comparing cell invasion of the indicated cells. Scale bar: 100 μm. Bars are the mean ± SD of three independent experiments. ##P < 0.01 when compared to vector‐shScramble cells, **P < 0.01 when compared to ESM1‐NLS‐shScramble cells by two‐tailed Student’s t‐test.
Source data are available online for this figure.
