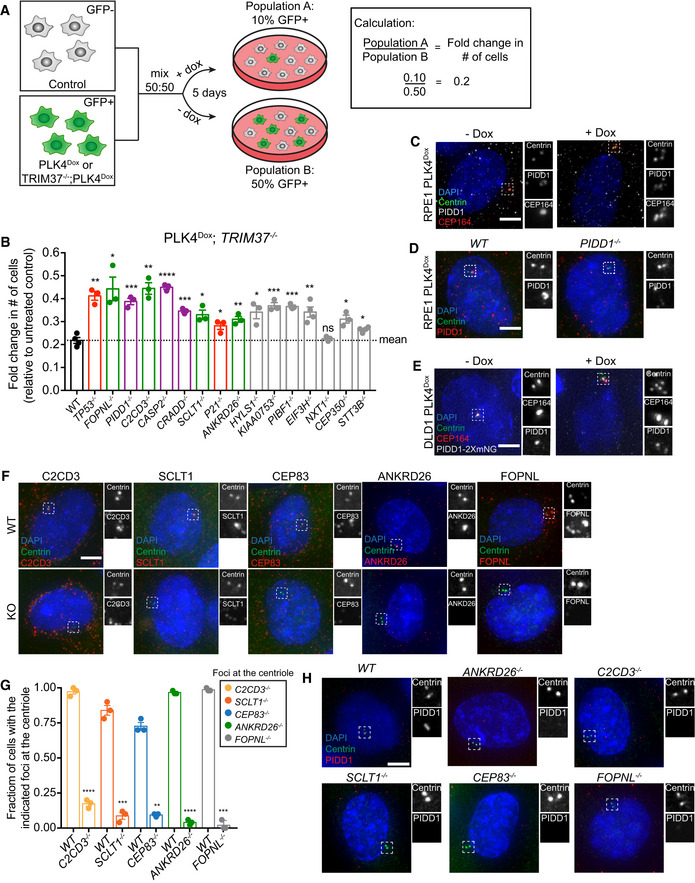
Figure EV1. PIDD1 is recruited to the centriole distal appendage.

- Schematic outlining the competition growth assay used to measure fold change in the number of GFP+ cells treated with doxycycline compared to control, untreated GFP− cells.
- Graph showing the relative growth of doxycycline‐treated PLK4Dox; TRIM37 −/− cells expressing an sgRNA targeting the indicated genes. Each dot displays measurements from a single experiment. Experiments were performed in polyclonal knockout cells. Data acquired across n ≥ 3 biological replicates. Mean ± s.e.m.
- Representative images of PLK4Dox RPE1 cells treated with and without doxycycline for two days and immunostained with the indicated antibodies. Scale bar = 5 µm.
- Representative images of wild‐type and PIDD1 −/− PLK4Dox RPE1 cells treated with and without doxycycline for two days and immunostained with the indicated antibodies. Scale bar = 5 µm.
- Representative images of PLK4Dox PIDD1‐mNeonGreen DLD1 cells treated with and without doxycycline for 2 days and immunostained with the indicated antibodies. Scale bar = 5 µm.
- Representative images of WT or knockout PLK4Dox cells immunostained with the indicated antibodies. Experiments were performed in PLK4Dox monoclonal knockout cells. Scale bar = 5 µm.
- Quantification of the fraction of cells with the indicated protein localized at the centriole. Experiments were performed in PLK4Dox monoclonal knockout cells. Data acquired across n = 3 biological replicates. Mean ± s.e.m.
- Representative images of WT or knockout PLK4Dox cells immunostained with the indicated antibodies. Experiments were performed in PLK4Dox monoclonal knockout cells. Scale bar = 5 µm.
Data information: Asterisks indicate statistically significant differences between measurements (*P < 0.05; **P < 0.01; ***P < 0.001, ****P < 0.0001). Statistics for all Figures were calculated using a two‐tailed Student’s t‐test.
Source data are available online for this figure.
