
Figure 2. Distal appendage proteins are required to recruit PIDD1 to the mature parent centriole.
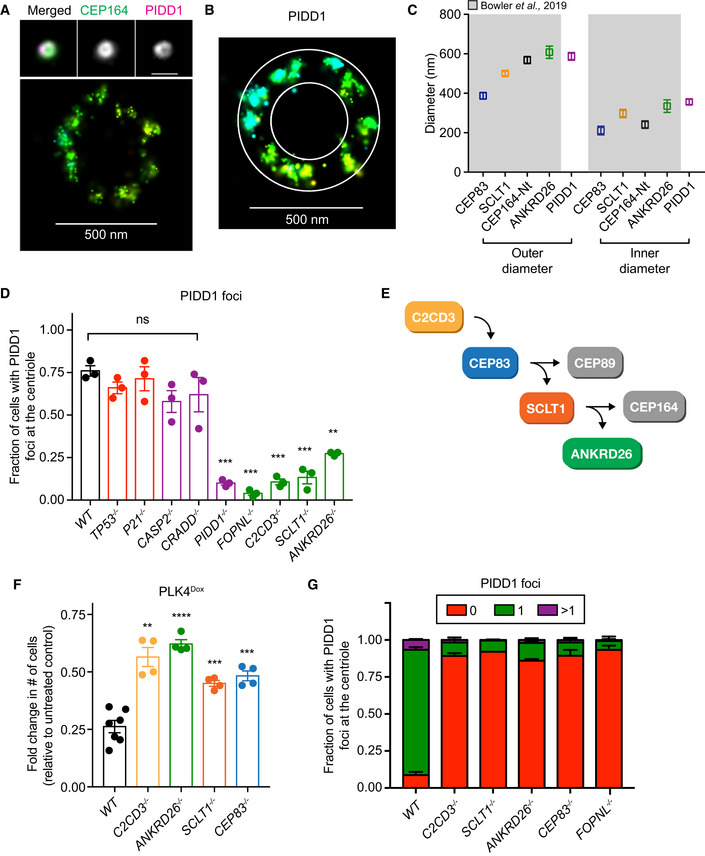
- Top, wide‐field image showing the localization of CEP164 and PIDD1 at the mature mother centriole. Bottom: Representative 3D STORM image of the same centriole showing PIDD1 localization. STORM image colors correspond to the Z‐depth with red being the closest to the coverslip and blue being the most distant.
- 3D STORM image of PIDD1 at the mature mother centriole. The overlaid mask represents the inner and outer diameters of the PIDD1 signal.
- Inner and outer diameter measurements for distal appendage proteins and PIDD1. Measurements in the shaded region were previously reported in Bowler et al (2019). Data displayed as box and whisker plots, where the box represents the upper and lower quartile and the whiskers represent the s.d. Scale bars: 1 μm for all wide‐field images of centrioles and 500 nm for STORM images. Data acquired across n ≥ 6 cells.
- Quantification of the fraction of cells with PIDD1 localized to the mature mother centriole in PLK4Dox cells expressing an sgRNA targeting the indicated genes. A dot displays measurements from each experiment. Experiments were performed in PLK4Dox polyclonal knockout cells. Data acquired across n = 3 biological replicates. Mean ± s.e.m.
- Schematic depicting the hierarchy of recruitment of distal appendage proteins.
- Graph showing the relative growth of doxycycline‐treated PLK4Dox cells that were knocked out for the indicated genes. Each dot displays measurements from a single experiment. Experiments were performed in PLK4Dox monoclonal knockout cells. Data acquired across n ≥ 3 biological replicates. Mean ± s.e.m.
- Quantification of the fraction of cells with PIDD1 localized at the mature mother centriole. Experiments were performed in PLK4Dox monoclonal knockout cells. Data acquired across n = 3 biological replicates. Mean ± s.e.m.
Data information: Asterisks indicate statistically significant differences between measurements (**P < 0.01; ***P < 0.001, ****P < 0.0001). Statistics for all Figures were calculated using a two‐tailed Student’s t‐test.
Source data are available online for this figure.