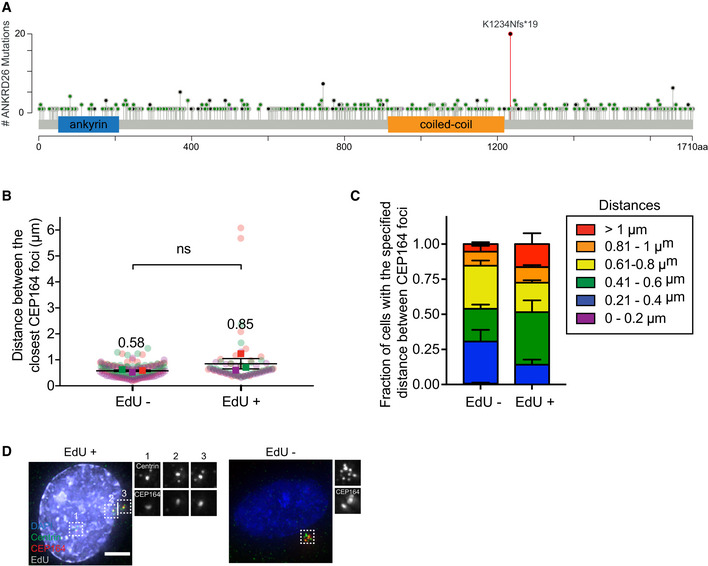
Figure EV5. A recurrent ANKRD26 mutation is observed in human tumors.

- Schematic showing the location of the 533 mutations in ANKRD26 in human tumors. Black represents truncating mutations; green represents missense mutations; purple represents inframe mutations. The K1234Nfs*19 mutation is shown in red. Data from curated set of non‐redundant studies in cBioPortal (Cerami et al, 2012).
- Plot showing the distance between the closest CEP164 rings in cycling (EdU+) and non‐cycling (EdU− cells). Squares show the mean for each biological replicate; colored circles show individual data points from each of the replicates. Data acquired across n = 3, biological replicates, each with > 20 cells. P values, unpaired two‐tailed t‐test. Mean ± s.e.m.
- Stacked bar graphs of the same data shown in (B). Mean ± s.e.m.
- Representative images of PLK4Dox RPE1 cells treated with and without doxycycline for two days and immunostained with the indicated antibodies. Scale bar = 5 µm.
Source data are available online for this figure.
