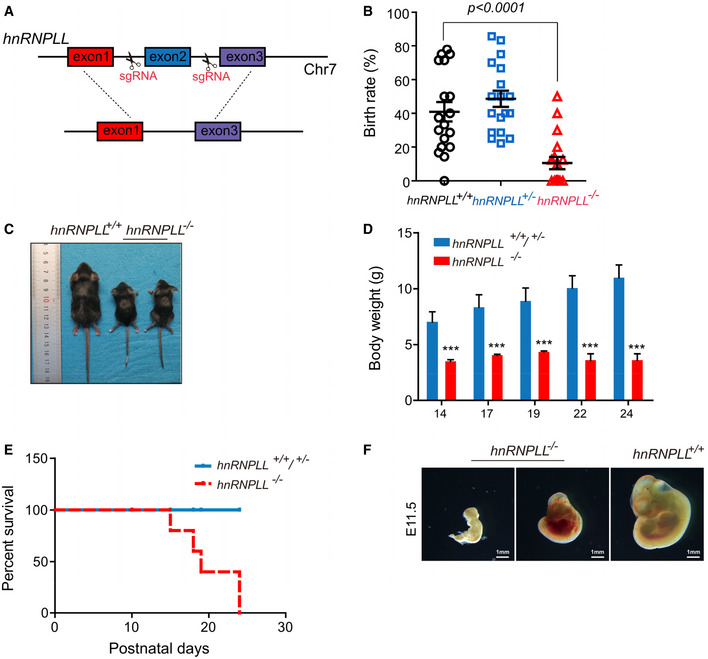
Figure 4. hnRNPLL‐deficient mice are developmental impaired and growth retarded.

- Schematic of hnRNPLL knockout mouse, in which its exon two is deleted.
- Birth rate of the different hnRNPLL genotypes, the birth rate of hnRNPLL −/− mice was significantly lower than that of WT hnRNPLL +/+ mice. The data represent the means ± SD. t‐Test was used to determine the significance.
- Representative images of hnRNPLL +/+ and hnRNPLL −/− littermates at 3 weeks.
- Body weight growth curve of mice at different postnatal days. The data represent the means ± SD (n = 5–10). ***P < 0.001. t‐Test was used to determine the significance.
- Survival curve analysis for hnRNPLL +/+, hnRNPLL +/−, and hnRNPLL −/−mice (ten mice in hnRNPLL +/+/+/− group and seven mice in hnRNPLL −/−group).
- Genotypes and representative images of hnRNPLL +/+ embryo and retarded hnRNPLL −/− embryos at E11.5 which generated from hnRNPLL +/− intercrosses. Scale bar, 1 mm.
