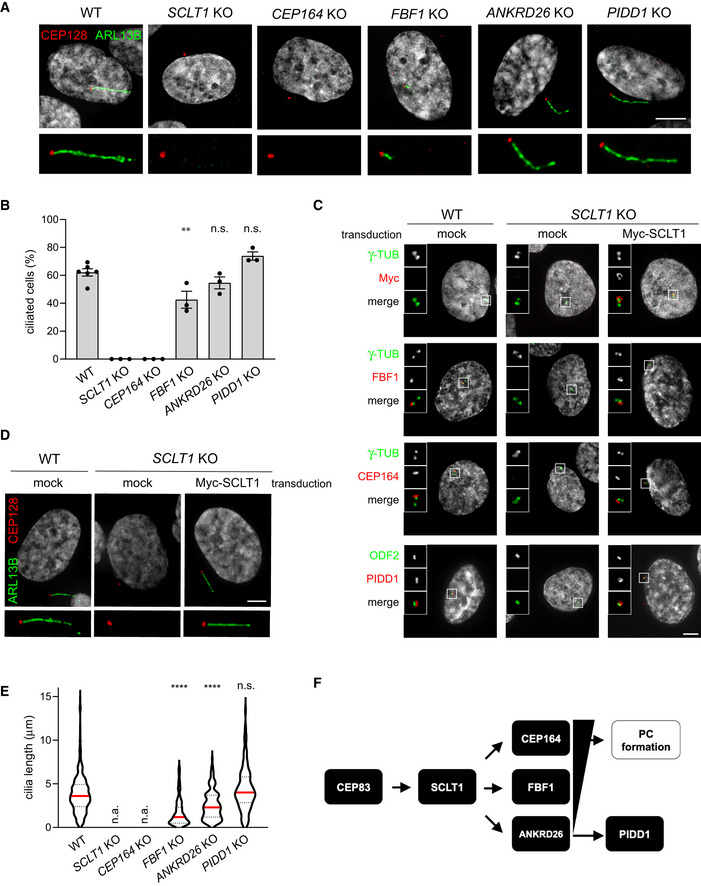
RPE1 cells of the indicated genotypes were subjected to serum‐starvation followed by immunofluorescence with the indicated antibodies to visualize the PC. Representative micrographs are shown. Blow‐ups without Hoechst 33342 are magnified 2×. Scale bar: 5 μm.
The percentage of ciliated cells was assessed by visual scoring of micrographs as in (A) across 3 biological replicates, with ≥ 50 cells per replicate. Individual values of biological replicates, their mean ± s.e.m. are reported. ANOVA test, comparing each sample to the wild type (**P < 0.01; n.s. = non‐significant).
Fluorescence micrographs of RPE1 cells of the indicated genotypes, either left untransduced (mock) or transduced with a lentiviral vector expressing Myc‐SCLT1, and co‐ stained with the indicated antibodies. Blow‐ups without Hoechst 33342 are magnified 2.5×. Scale bar: 5 μm.
RPE1 cells of the indicated genotypes were either left untransduced (mock) or transduced with a lentiviral vector expressing Myc‐SCLT1 and subjected to serum‐starvation. Immunofluorescence with the indicated antibodies allowed visualization of the PC. Representative micrographs are shown. Blow‐ups without Hoechst 33342 are magnified 2×. Scale bar: 5 μm.
Ciliary length was measured from the same dataset described in (B), violin plots showing values for individual cilia obtained by pooling at least three biological replicates (≥ 150 cells); n.a. = not applicable due to absence of ciliated cells. Median values (red lines) and quartiles (black, dashed lines) are shown. Kruskal–Wallis test, comparing each sample to the wild type (****P < 0.0001; n.s. = non‐significant).
Scheme summarizing the epistatic interdependencies between DAPs emerging from data displayed in Fig
1 and the functional implications described in this figure. PC = primary cilium.

