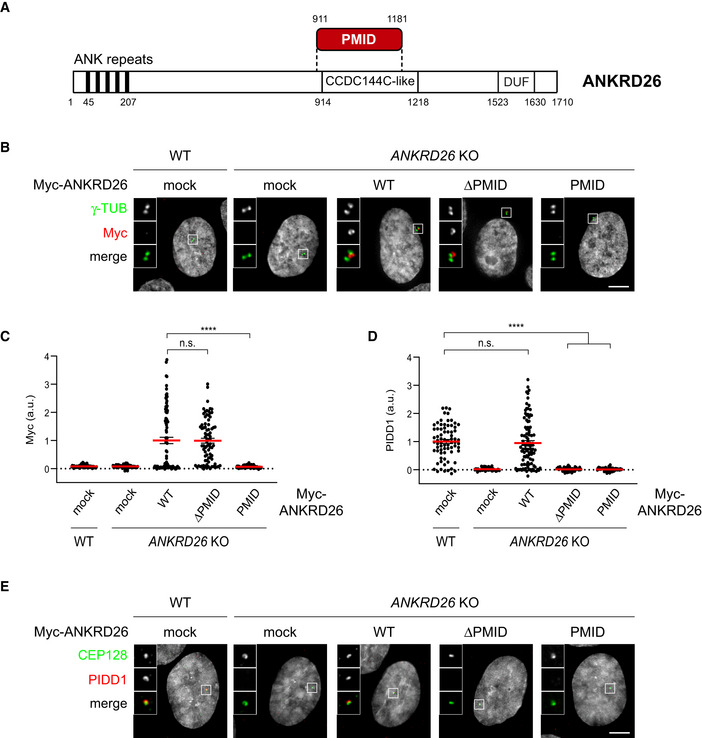
Figure 2. ANKRD26 directly interacts with PIDD1 at DAs.

- Schematic of the ANKRD26 domain identified as PIDD1 interactor by yeast‐two‐hybrid screen. PMID = PIDD1 Minimal Interaction Domain; CCDC144C‐like = Coiled‐Coil Domain similar to CCDC144C; DUF: Domain of Unknown Function.
- Representative fluorescent micrographs of RPE1 cells of the indicated genotypes, either transduced with the indicated lentiviral vectors or left untransduced (mock). Cells were co‐stained with the indicated antibodies. Blow‐ups without Hoechst 33342 are magnified 2.5×. Scale bar: 5 µm.
- Dot plot showing the average pixel intensities of the Myc signal at individual parent centrioles in RPE1 cells of the indicated genotypes, either transduced with the indicated lentiviral vectors or left untransduced (mock). Mean values (red lines) ± s.e.m. are reported. N > 50 centrosomes were assessed for each condition in as many individual cells; a.u. = arbitrary units. Kruskal–Wallis test (****P < 0.0001; n.s. = non‐significant).
- Dot plot showing the average pixel intensities of the PIDD1 signal at individual parent centrioles in RPE1 cells of the indicated genotypes, either transduced with the indicated lentiviral vectors or left untransduced (mock). Mean values (red lines) ± s.e.m. are reported. N > 50 centrosomes were assessed for each condition in as many individual cells; a.u. = arbitrary units. Kruskal–Wallis test (****P < 0.0001; n.s. = non‐significant).
- Representative fluorescent micrographs of RPE1 cells of the indicated genotypes, either transduced with the indicated lentiviral vectors or left untransduced (mock). Cells were co‐stained with the indicated antibodies. Blow‐ups without Hoechst 33342 are magnified 2.5×. Scale bar: 5 µm.
