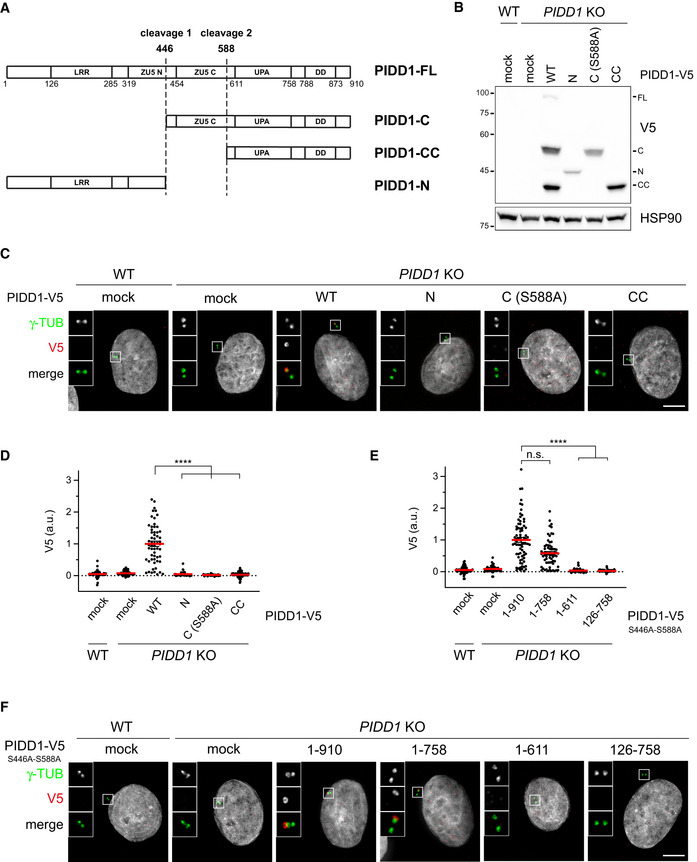
Figure 4. Only the PIDD1 non‐cleaved precursor is capable of localizing to centriole DAs.

- Schematic of the PIDD1 domain structure and of the different PIDD1 species generated by autoproteolysis. LRR = Leucin‐Rich Repeat Domain; ZU5 (N and C) domains = Domain present in ZO‐1, Unc5‐like netrin receptors and in ankyrins; UPA domain = conserved in UNC5, PIDD and Ankyrins; DD = death domain.
- A549 cells of the indicated genotypes were either left untransduced (mock) or transduced with lentiviral vectors expressing the indicated PIDD1‐V5 derivatives and subjected to immunoblotting. N = 2 independent experiments.
- Fluorescence micrographs of A549 cells of the indicated genotypes either left untransduced (mock) or transduced with PIDD1‐V5 lentiviral vectors as in (B), and co‐stained with the indicated antibodies. Blow‐ups without Hoechst 33342 are magnified 2.5×. Scale bar: 5 μm.
- Dot plot showing the average V5 pixel intensities at individual parent centrioles in A549 cells of the indicated genotypes, either transduced with the indicated lentiviral vectors or left untransduced (mock). Mean values (red lines) ± s.e.m. are reported. Data obtained from images as in (C). N > 50 centrosomes were assessed for each condition in as many individual cells; a.u. = arbitrary units. Kruskal–Wallis test (****P < 0.0001).
- Dot plot showing the average V5 pixel intensities at individual parent centrioles in A549 cells of the indicated genotypes, either transduced with the indicated lentiviral vectors or left untransduced (mock). Mean values (red lines) ± s.e.m. are reported. Data obtained from images as in (F). N > 50 centrosomes were assessed for each condition in as many individual cells; a.u. = arbitrary units. Kruskal–Wallis test (****P < 0.0001; n.s. = non‐significant).
- Representative fluorescence micrographs of A549 cells of the indicated genotypes. Cells were either left untransduced (mock) or transduced with PIDD1‐V5 lentiviral vectors expressing the PIDD1 non‐cleavable derivative (PIDD1S446A‐S588A) or truncations thereof. Blow‐ups without Hoechst 33342 are magnified 2.5×. Scale bar: 5 μm.
Source data are available online for this figure.
