
Figure 1. Small PI(3,4)P2 vesicles supply PI(3,4)P2 to the back of migrating Dictyostelium cells.
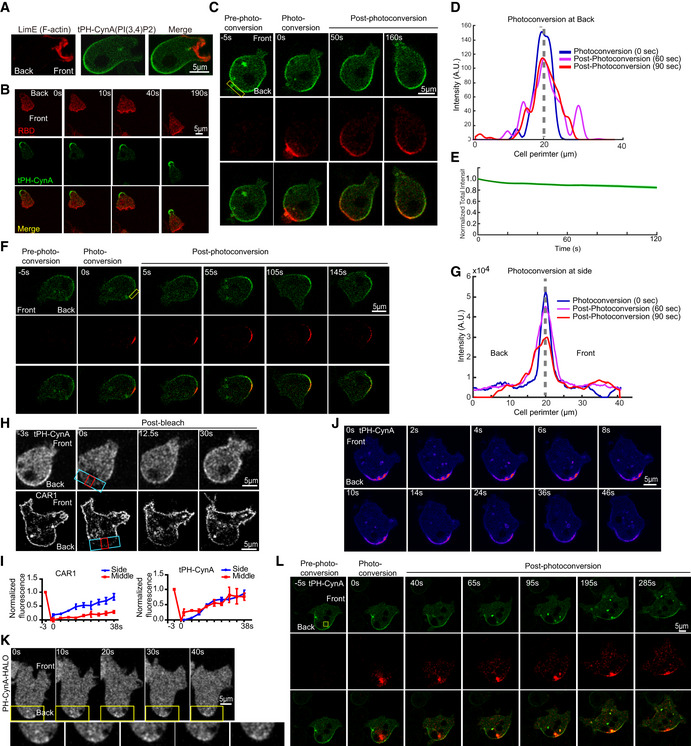
- Confocal images of growth‐stage wild‐type Dictyostelium AX3 cell co‐expressing tPH‐CynA‐KikGR (green) and an F‐actin biosensor LimE‐RFP (red). Front and back of the cell are shown.
- Time‐lapse confocal images of growth‐stage AX3 cell co‐expressing tPH‐CynA‐KikGR (green) and an activated Ras biosensor, RBD‐mCherry (red). Front and back of the cell are shown.
- Time‐lapse confocal images of tPH‐CynA‐KikGR expressing AX3 cells. Back region of cells was photoconverted from green fluorescence to red at t = 0 s. Front and back of the cell are shown, box showing the photoconverted region.
- Profiles of the converted red fluorescence at the back remain almost symmetric over time. The dotted line represents the axis of symmetry of the intensity profile of the photoconverted fluorophores at t = 0.
- Temporal profile of normalized intensity of total converted red fluorescence. Mean ± SEM is shown for n = 14 cells.
- Time‐lapse confocal images of tPH‐CynA‐KikGR expressing AX3 cells during photoconversion. Side region of cells was photoconverted at time 0. Green fluorescence was converted to red. Front and back of the cell are shown. Box shows the photoconverted region.
- Profiles of the converted red fluorescence at side become skewer (steeper near the front) over time. The dotted line represents the axis of symmetry of the intensity profile of the photoconverted fluorophores at t = 0.
- Confocal fluorescent images of tPH‐CynA‐KikGR (top) and CAR1‐mcherry (bottom) Dictyostelium AX3 cell showing the bleached area and the side (blue) and middle (red) boxes where the fluorescence recovery is monitored. Front and back of the cell are shown.
- The graphs depict the recovery of CAR1‐mcherry (left) and tPH‐CynA‐KikGR (right). Mean ± SEM is shown for n = 2 cells.
- Time‐lapse confocal images of tPH‐CynA‐KikGR expressing AX3 cells showing docking events at the back of a migrating Dictyostelium cell. Front and back of the cell are shown.
- Time‐lapse confocal images of PH‐CynA‐HALO expressing AX3 cells showing high PH‐CynA vesicles accumulation at the back of a migrating Dictyostelium cell. Front and back of the cell are shown.
- Time‐lapse confocal images of tPH‐CynA‐KikGR (green) expressing AX3 cells. Back cortical region of cell was photoconverted at time 0. Green fluorescence was converted to red. Front and back of the cell is shown, box showing the photoconverted region.
Source data are available online for this figure.