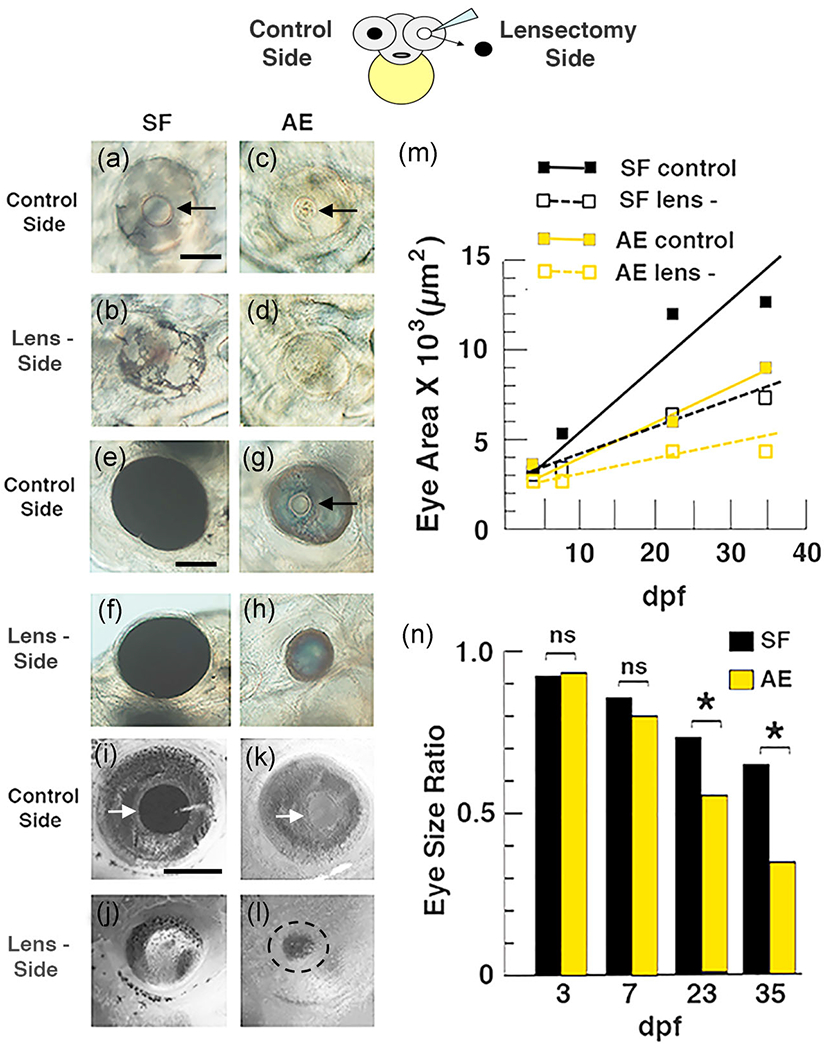
FIGURE 5.

Top. Diagram illustrating the lensectomy experiments shown below and in Figure S2. (a–n) Effects of lens deletion on eye size and growth rate in surface fish (SF) and F4 albino eyed (AE) strain larvae. (a–l) Eye size on the lensectomy and control sides of the same larvae at 3 days post-fertilization (dpf) (a–d), 6 dpf (e–h), and 15 dpf (i–l) Arrows: lens. Scale bar in (a) = 200 μm; magnification is the same in (a–d). Scale bar in (e) = 200 μm; magnification is the same in (e–h). Scale bar in (i) = 300 μm; magnification is the same in (i–l). (m) Eye growth on the lensectomy and control sides during AE and SF development. Best fit lines for eye growth rates were calculated from eye measurements and developmental times using the least squares method. (n) Bar graphs showing developmental changes in eye size ratios on the lensectomy and control sides during AE and SF development. The data used to illustrate (m) and (n), including means, SEMs, sample numbers, and significance values, are listed in Tables S1 and S2 respectively
