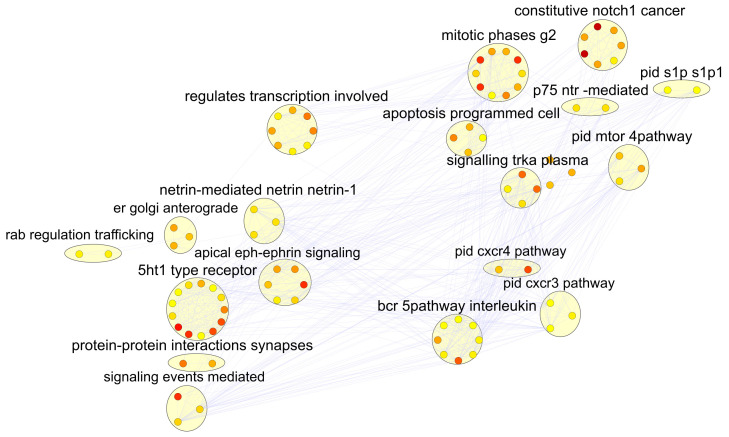
Figure 11. Enrichment map showing top-scoring pathway features for classifying case-control autism using rare CNVs.
Nodes show pathway features cumulatively scoring 13 or higher out of 30, while edges connect pathways with common member genes. Node fill indicates pathway score, with yellow for the lowest and red for the highest.

