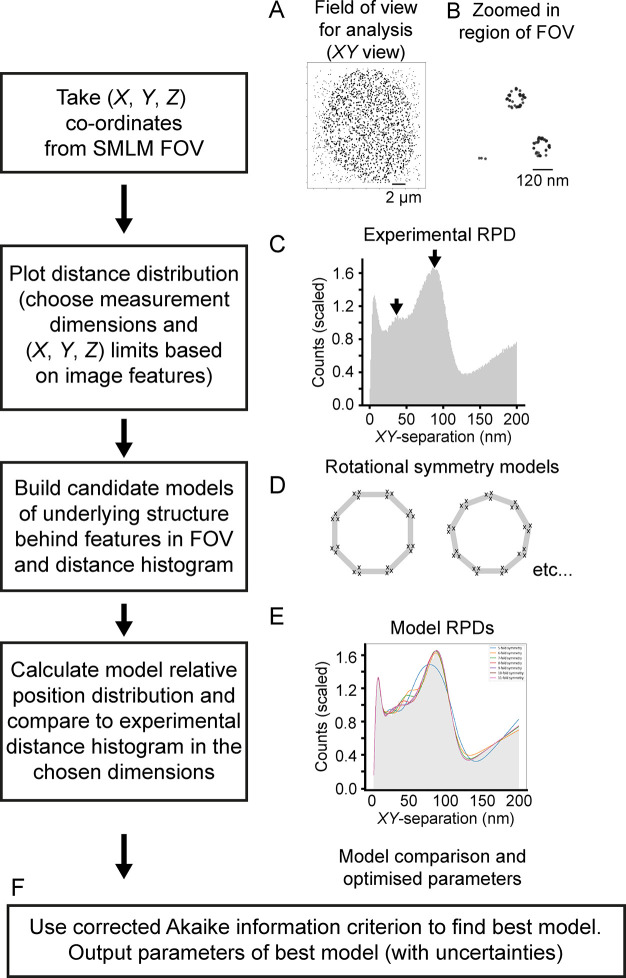
Figure 1.
Workflow in PERPL analysis. The figure demonstrates the workflow for PERPL analysis, with the series of steps shown on the LHS and snapshot images on the RHS (for illustrative purposes only). A, B: Visualization of the localization data in XY for the full FOV (A) and a zoomed in region (B). C: Experimental relative position distribution (RPD), histogram of interlocalization distances. Arrows indicate peaks resulting from underlying molecular organization. D: Example in silico rotational symmetry models. E: Plots for different in silico model RPDs (colored lines), fitted to the experimental RPD. F: Use of the Akaike information criterion to compare models and output of model parameters.

