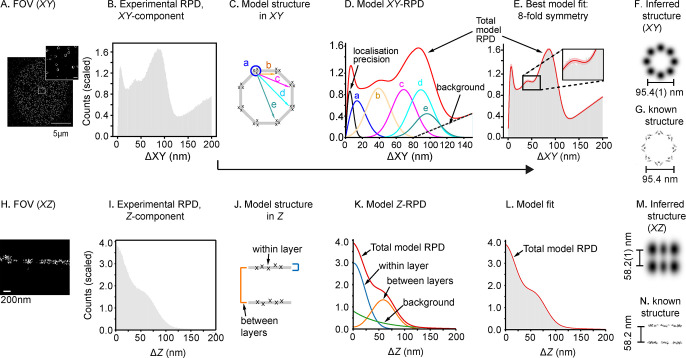
Figure 2.
PERPL analysis of Nup107 localizations. A: 2D image reconstruction of a 3D dSTORM data set for Nup107. Scale bar (inset): 200 nm. B: Experimental RPD (XY, 1 nm bins) for all pairs of localizations within 200 nm in X, Y, and Z. Mean bin value scaled to 1.0. C: Diagram of in silico model of 8-fold symmetric macromolecular geometry. D: Resulting RPD (XY-component). The model contains intervertex distances (b–e), with vertices arranged symmetrically on a circle, components for repeated localizations of a single molecule (localization precision), unresolvable substructure in a cluster (a), and a background term. E: The in silico model RPD fitted to the experimental distance histogram (pink is 95% confidence interval). F, G: Inferred 8-fold structure in XZ (F), in agreement with EM data for Nup107 organization19 (G). H–L: Nup107 localizations rendered in XZ, experimental RPD in Z, two-layer model structure used to generate the model Z-RPD, fitted to the experimental RPD. M: Inferred XYZ structure, projected in XZ (Gaussian smoothed according to the fitted broadening parameters in the models). N: EM data in XZ.19 EM maps of the nuclear pore shown in (G) and (N) generated from PDB 5A9Q using UCSF Chimera.20

