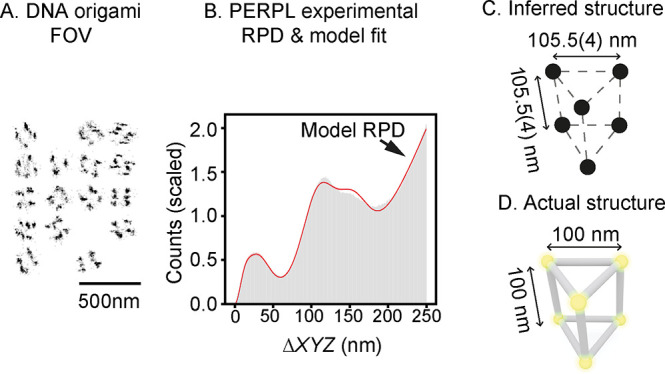
Figure 3.

PERPL analysis of a DNA origami nanostructure. A: Image reconstruction for the DNA origami sample (projection in XY). B: Comparison of the experimental and model (red line) RPDs. C: Diagram of the best-supported model (triangular prism). D: Actual structure, as designed.
