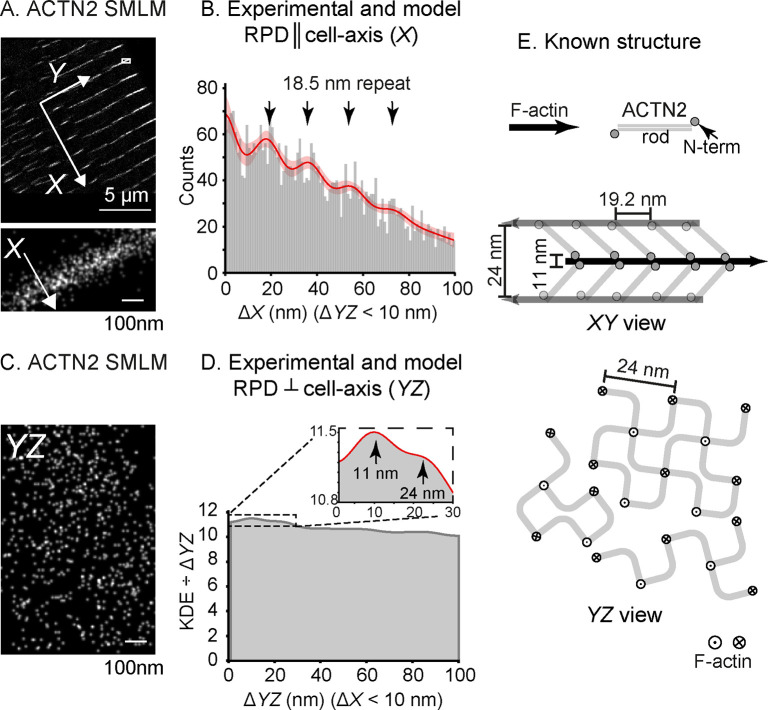
Figure 4.
PERPL analysis of 3D ACTN2 dSTORM data for adult rat cardiomyocyte, sparsely labeled. A: FOV for the 3D dSTORM data set, using an Affimer to ACTN2. X: cell-axial direction (perpendicular to the plane of the Z-disc). Y: in the plane of the Z-disc. Inset: magnified region of the image. B: Experimental RPD in X for pairs of localizations with ΔYZ < 10 nm. Model RPD shown by the red line with 95% confidence interval (pink). Arrows indicate peaks with a repeat distance of 18.5(1.0) nm. C: Equivalent YZ view for the inset of (A). D: Result for the YZ analysis, using the standardized kernel density estimate (KDE) (Figure S7). Inset shows the detailed view of the fit (red line) out to 30 nm and the positions of two peaks for characteristic distances (see text). E: Diagram of the known structure from EM27 showing XY and YZ views, with the known disorder in the square lattice in YZ.

