
Figure 5.
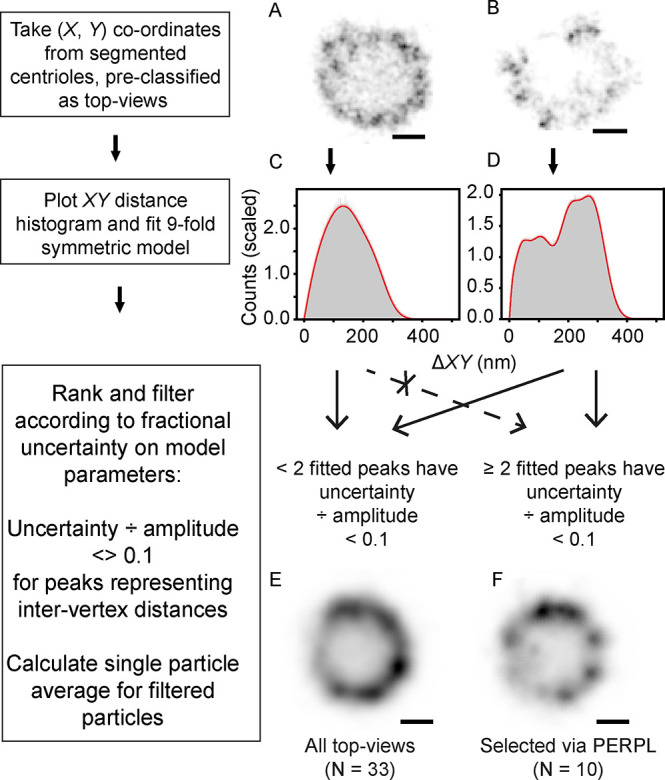
Use of PERPL analysis to assess single particle images and improve image averages. A, B: Example dSTORM reconstructions of Cep152, filtered as top views7 (fluorescence shown in inverted contrast). C, D: Distance histograms and fitted model RPDs (red, with narrow 95% confidence intervals in pink). E: Average of all top-view Cep152 images. F: Average of 10 top-view images selected after PERPL analysis. Scale bars: 100 nm.