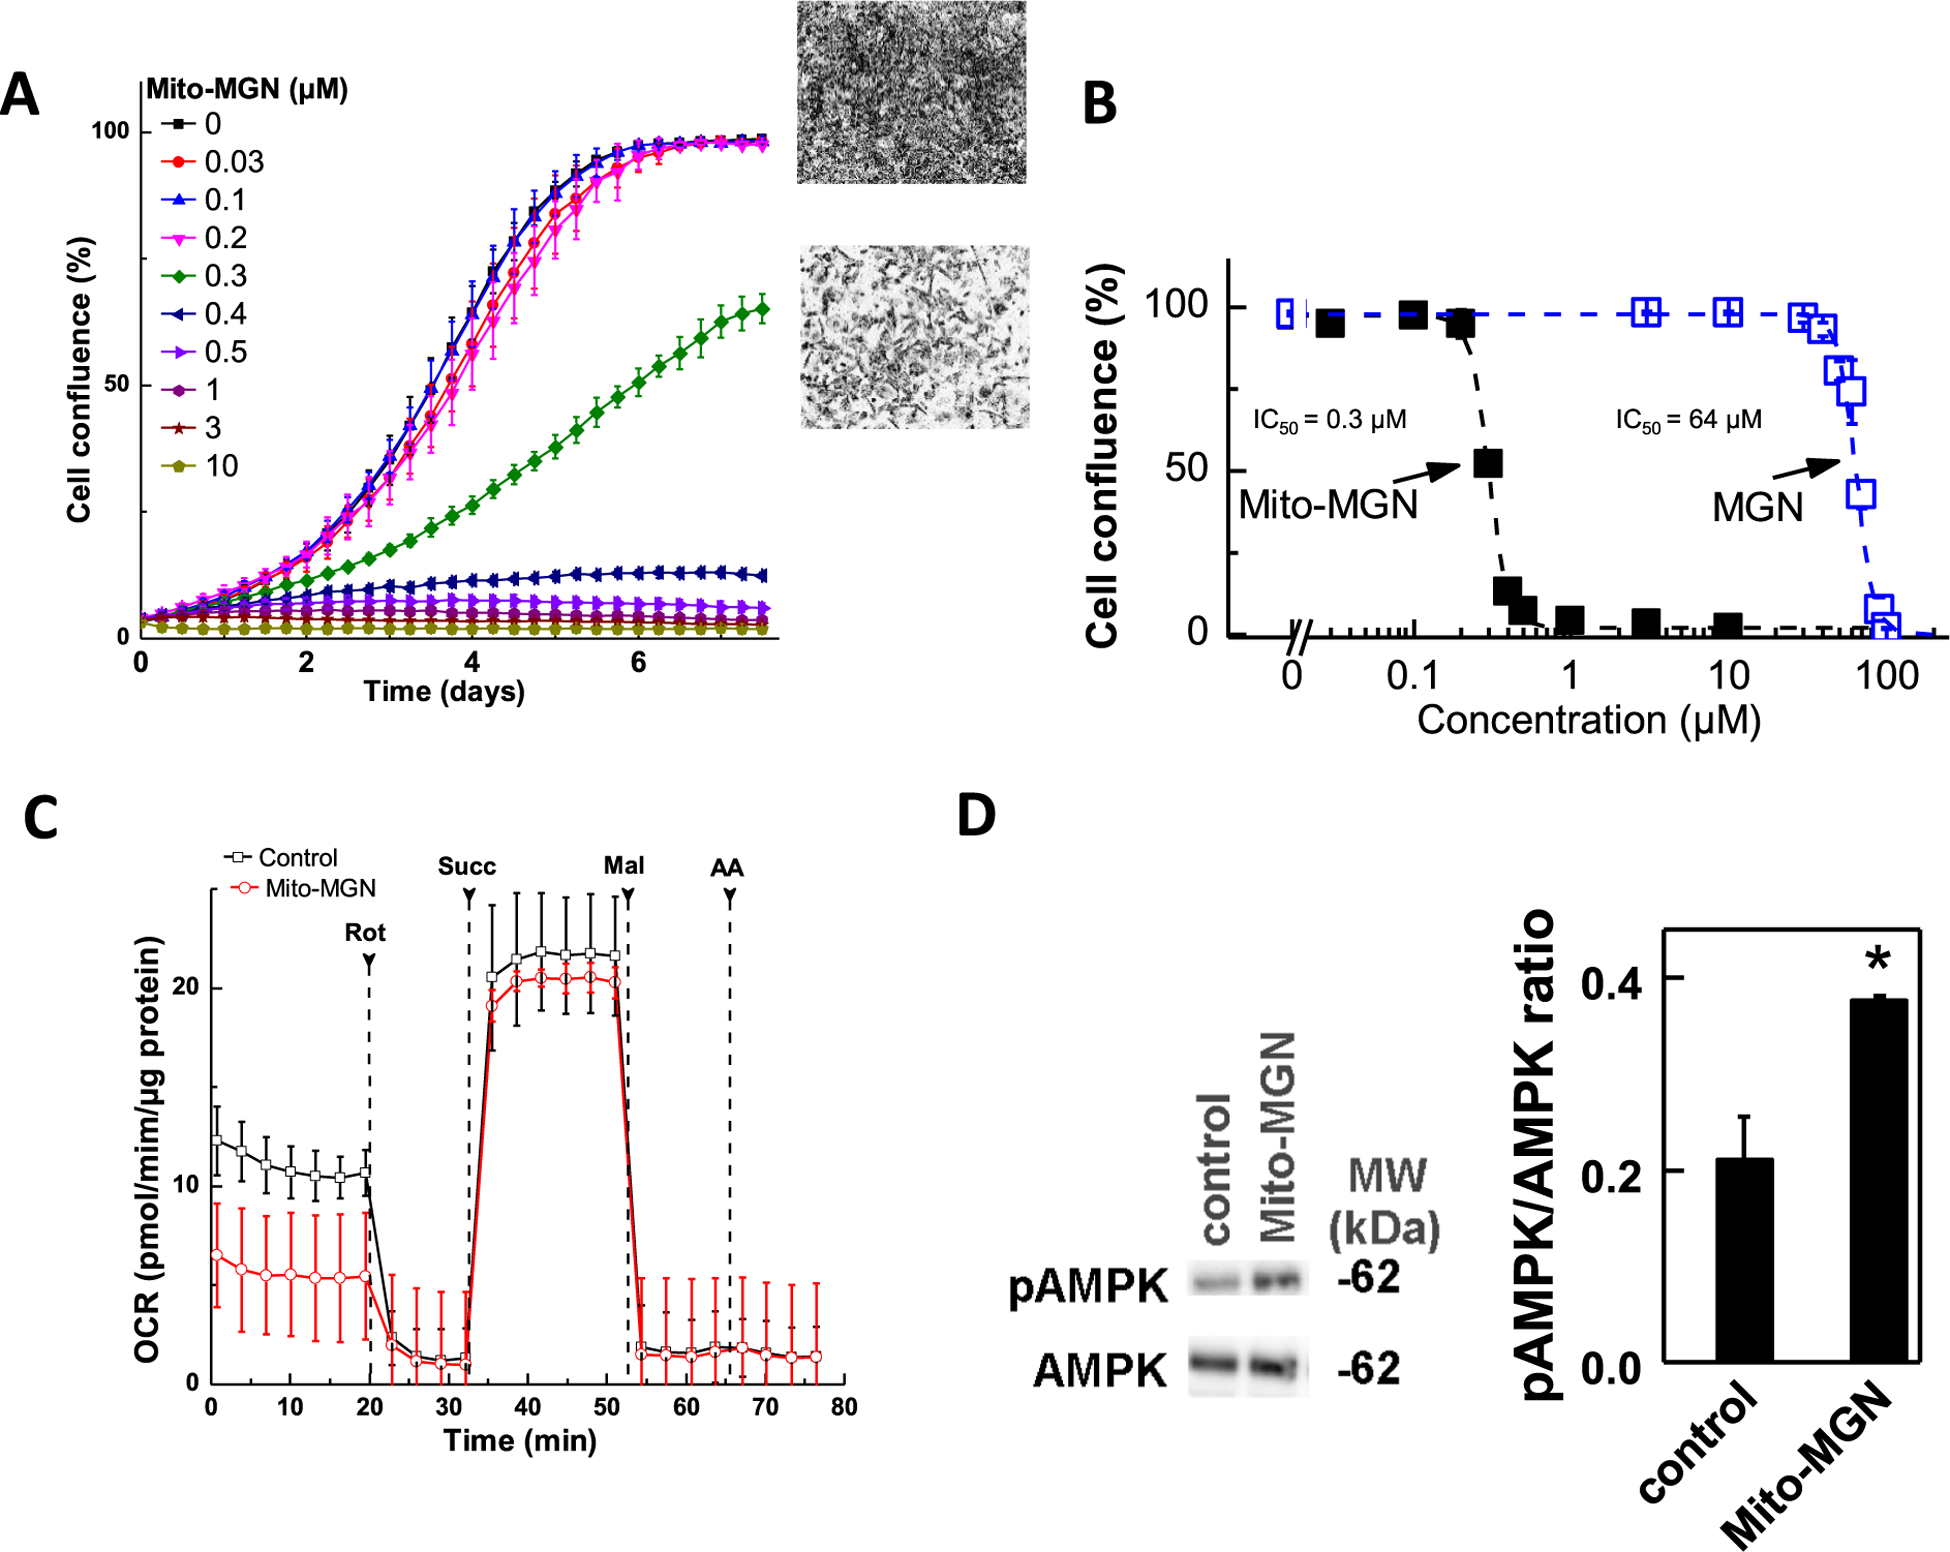
Fig. 2. Effect of Mito-MGN and MGN on UACC-62 melanoma cell proliferation and bioenergetics.

(A) Melanoma cells were cultured in the presence of Mito-MGN and MGN. Cell proliferation was monitored in real time using the IncuCyte imager. (B) Melanoma cell proliferation (measured as cell confluence) quantified from IncuCyte measurements. Data shown indicate the dose-dependent inhibition of confluence with increasing concentration of Mito-MGN and MGN in UACC-62 melanoma cells. The percentage of cell confluence (as control groups reached 98% confluence) is plotted against concentration. Dashed lines represent the fitting curves used to determine the IC50 values. (C) The melanoma cells were treated with Mito-MGN (0.2 μM) for 24 h before mitochondrial complex I and complex II activities were measured. Upon the mitochondrial complex activity measurements, cells were permeabilized and assayed in medium containing 10 mM pyruvate and 1.5 mM malate (substrates for complex I) in mannitol and sucrose buffer using the Seahorse XF96 analyzer. Basal OCR was measured before adding complex I inhibitor, rotenone (Rot, 1 μM). The rotenone inhibitable OCR was used as a measure of mitochondrial complex I activity. Then, succinate (Succ, 10 mM, substrate for complex II) and malonate (Mal, 10 mM, complex II inhibitor) were subsequently injected as indicated. The succinate-driven, malonate-inhibitable OCR was considered as a measure of mitochondrial complex II activity. Finally, antimycin A (AA, 20 μM), a complex III inhibitor, was injected to confirm the complete inhibition of OCR. (D) Effect of the treatment with 0.5 μM Mito-MGN for 24 h on AMPK and p-AMPK in UACC-62 cells.
