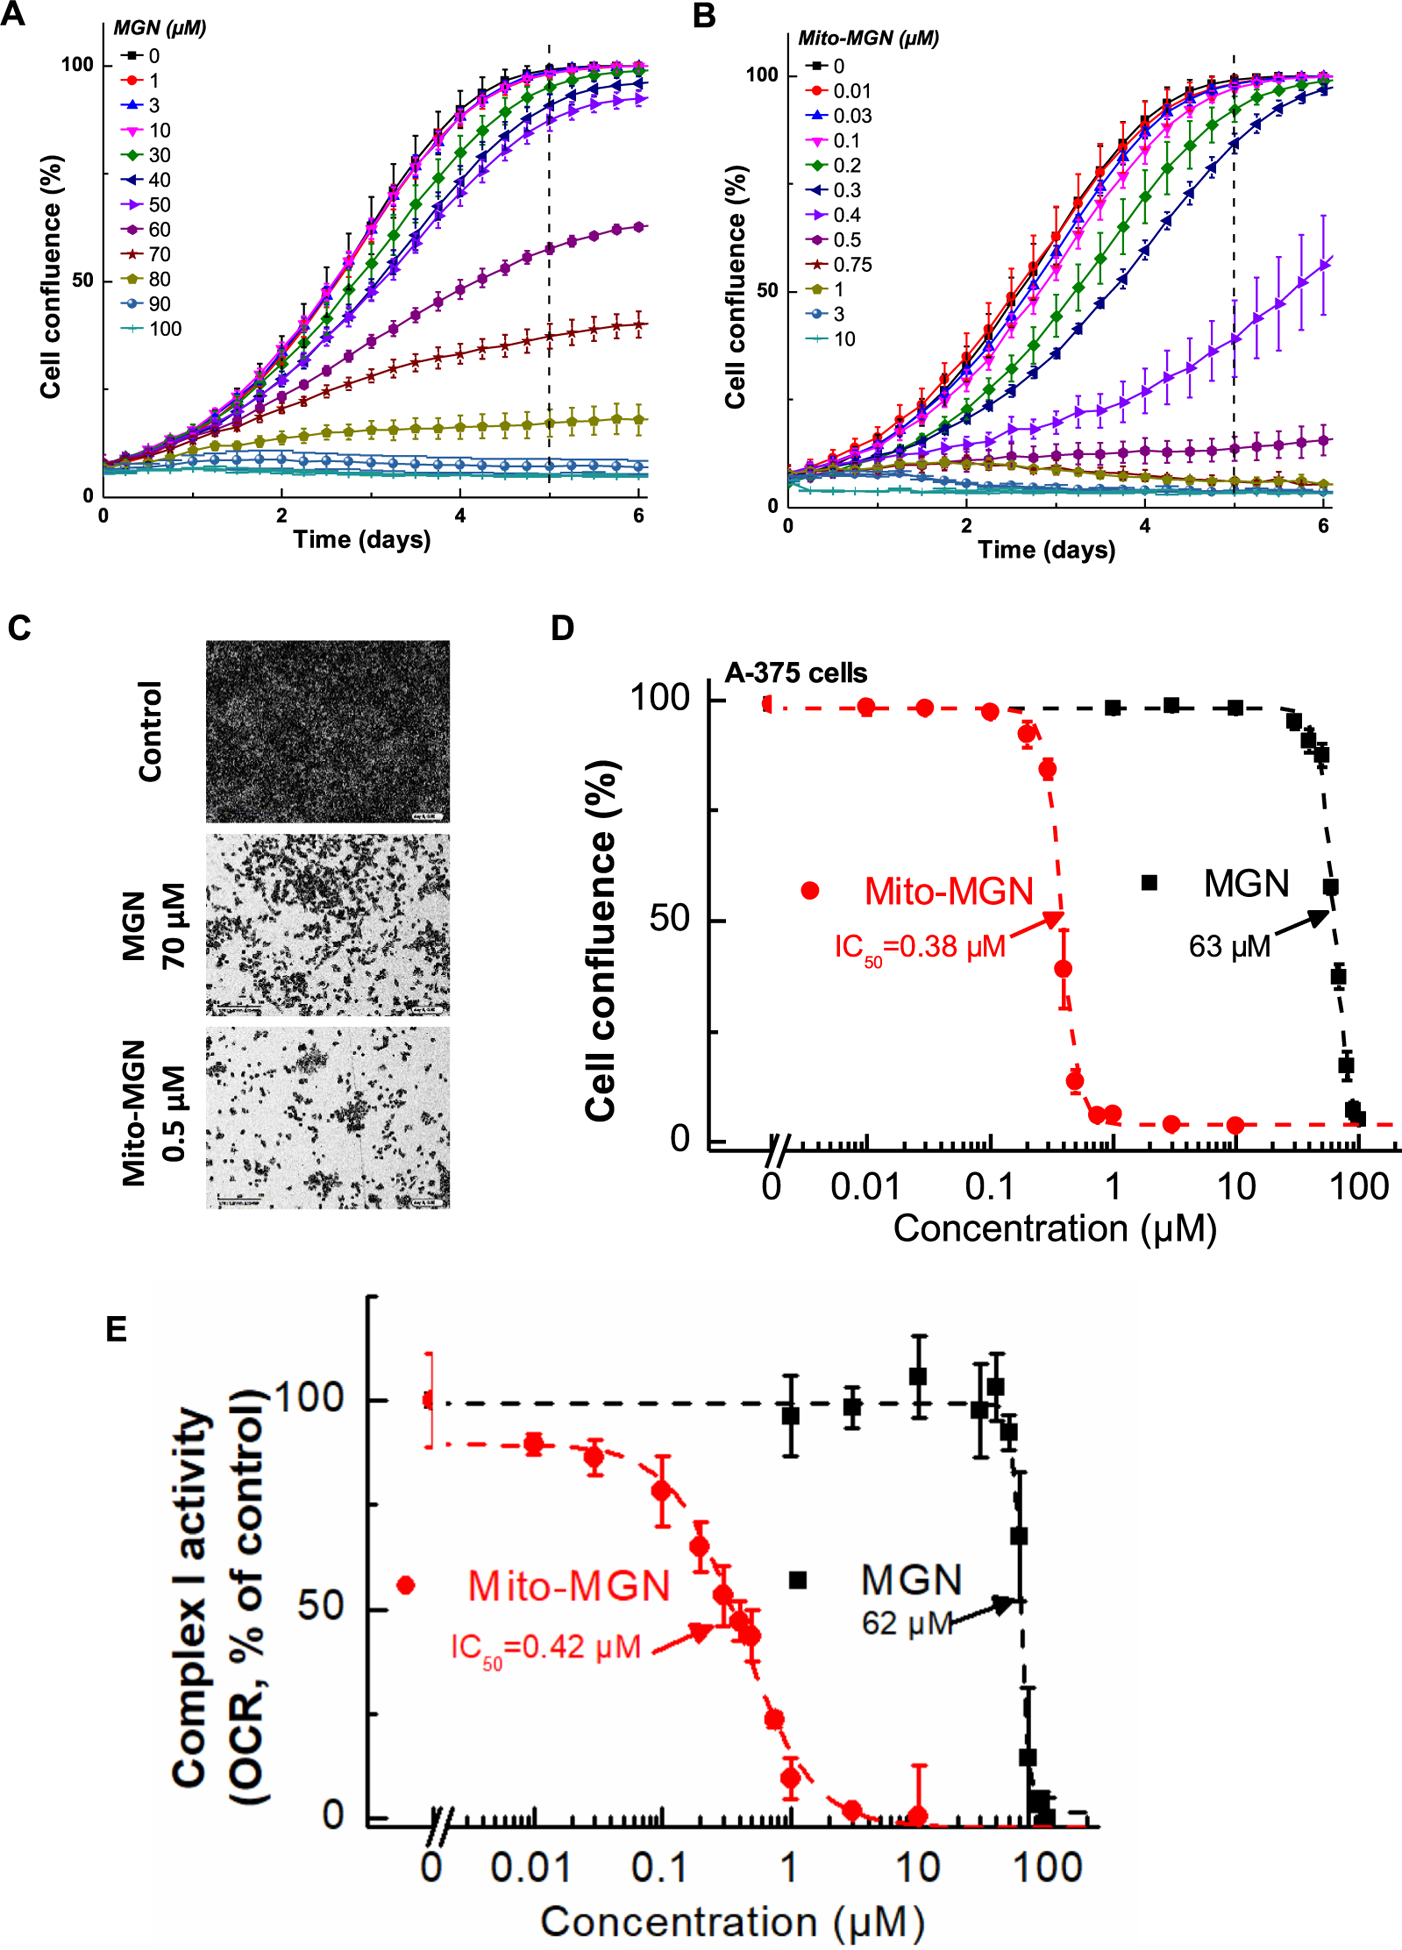
Fig. 3. Effects of MGN and Mito-MGN on proliferation and mitochondrial complex I activity of A375 melanoma cells.

(A, B) A375 melanoma cells were treated with MGN (A) or Mito-MGN (B). Cell proliferation was monitored in real time using the IncuCyte imager. (C) Representative phase contrast images (10×) of three replicate experiments. (D) The dependence of the cell confluence (as control groups reach 98% confluence) as a function of MGN and Mito-MGN concentrations. (E) Effect of MGN and Mito-MGN on the activity of mitochondrial complex I. A375 cells were pretreated with MGN and Mito-MGN for 24 h. The mitochondrial complex I OCR values are plotted against concentrations of MGN and Mito-MGN. Dashed lines represent the fitting curves used for determination of the IC50 values. Data shown are the means ± SD.
