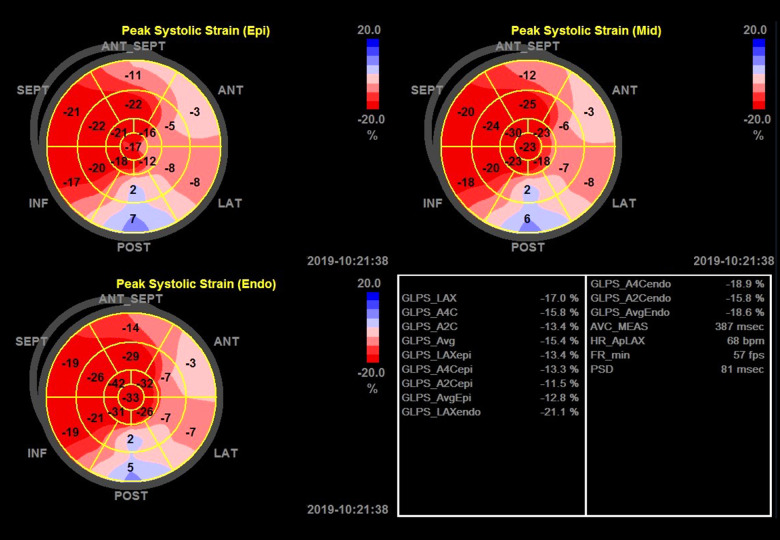
Figure 1.
Global and layer longitudinal peak strain assessed by 2D-STE in a patient with CAD in the bull’s eyes plots. The strain plots depict the peak systolic strain of epicardium layer, middle layer, and endocardium layer. The peak systolic strain in the 17 segments of the left ventricle are shown in the bulls-eye plots. The right lower panel indicates the global longitudinal peak systolic strain value of the left apical axis view, apical 4-chamber view, apical 2-chamber view, and the average values. ANT – anterior; GLPS – global lateral pulse strain; INF – inferior; LAT – lateral; SEPT – septum; LAX – apical long axis; A4C – apical 4-chamber; A2C – apical 2-chamber; epi – epicardium; endo – endocardium; AVC – atrioventricular contraction; PSD – peak strain deviation.

