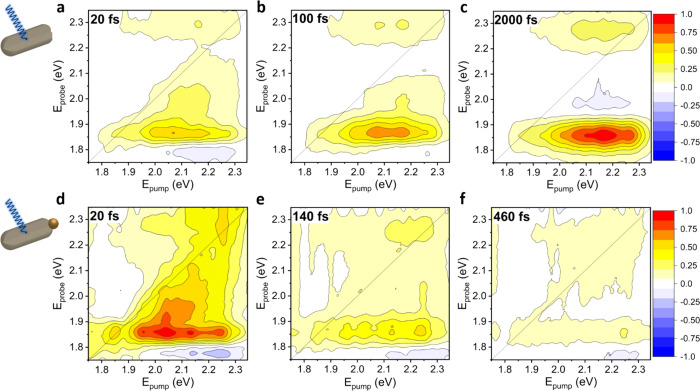
Figure 2.
2DES maps showing the normalized ΔT/T of CdSe NRs (a–c) at 20, 100, and 2000 fs following visible broadband excitation (pump fluence of 11.6 μJ/cm2) and (d–f) CdSe-Au HNPs at 20, 140, and 460 fs under the same conditions (pump fluence of 20.7 μJ/cm2). While the maps on top show a rising signal at Eprobe = 1.85 eV, the HNPs show a steadily decaying signal. The color map scale is normalized at the maximum signal among the three maps. The cartoons are merely representative; see Figure 1 for TEM data.

