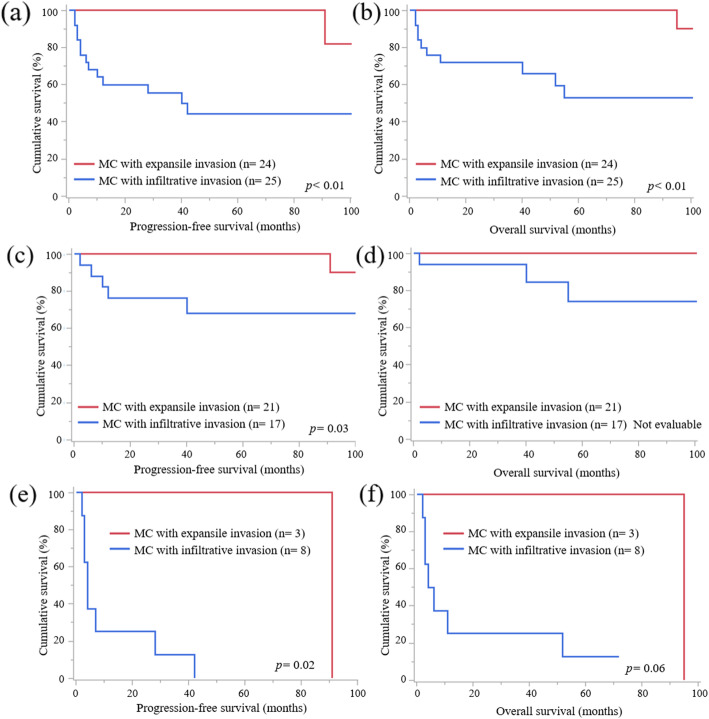
Fig. 2.
PFS and OS curves according to FIGO stage status
a PFS curves of cases of OMC with infiltrative invasion and expansile invasion in all FIGO stages. OMC with infiltrative invasion showed worse PFS than OMC with expansile invasion. b OS curves of cases of OMC with infiltrative invasion and expansile invasion in all FIGO stages. OMC with infiltrative invasion exhibited worse OS than OMC with expansile invasion. c PFS curves of cases of OMC with infiltrative invasion and expansile invasion in FIGO stage I and II. OMC with infiltrative invasion showed worse PFS than OMC with expansile invasion. d OS curves of cases of OMC with infiltrative invasion and expansile invasion in FIGO stage I and II. There were no statistical significances about OS between two groups. e PFS curves of cases of OMC with infiltrative invasion and expansile invasion in FIGO stage III and IV. OMC with infiltrative invasion showed worse PFS than OMC with expansile invasion. d OS curves of cases of OMC with infiltrative invasion and expansile invasion in FIGO stage III and IV. There were no statistical significances about OS between two groups

