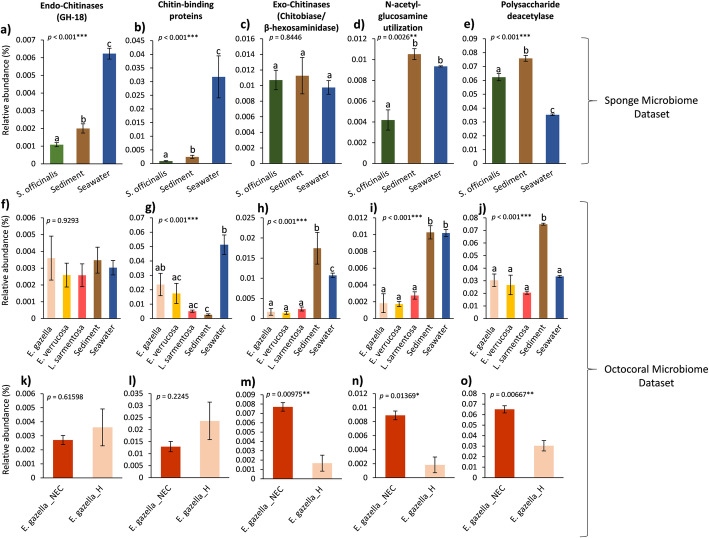
Fig. 3.
Relative abundance of chitin processing-encoding genes across marine biotopes. The analysis involved the screening of all microbial metagenomes for InterPro (IPR) database entries corresponding to the presence of GH18 endo-chitinase (a, f, k), chitin-binding protein (b, g, l), exo-chitinase (c, h, m), N-acetylglucosamine utilization (d, i, n), and polysaccharide deacetylase (e, j, o) coding sequences (CDSs) (see Additional file 1: Table S5 for details on the InterPro entries used here). The relative abundances (mean ± SE) of IPR entries pertaining to each functional category (calculated as “sum of all CDSs assigned to functional category x/total number CDSs with function”) are shown on Y-axes. One-way ANOVAs, followed by Tukey’s post hoc tests if significant (a to j) or t tests (k to o) were used to test for statistical differences between sample groups. Statistical analyses were performed after Hellinger transformation of the data (square root of relative abundances). Respective p values are given in each panel for general differences among groups and letters (a to j) or asterisks (k to o) above error bars indicate significant differences (p < 0.05). Panels (a to e) represent the sponge metagenome dataset (project ID PRJEB11585, [27] while panels (f to o) represent the octocoral metagenome dataset (project ID PRJEB13222, [28]. Panels (f to j) compare the healthy microbiome of octocoral species with those from their environmental vicinities, while panels (k to o) present relative abundances of chitin degradation-encoding genes in healthy versus necrotic tissue of Eunicella gazella

