FIG 1.
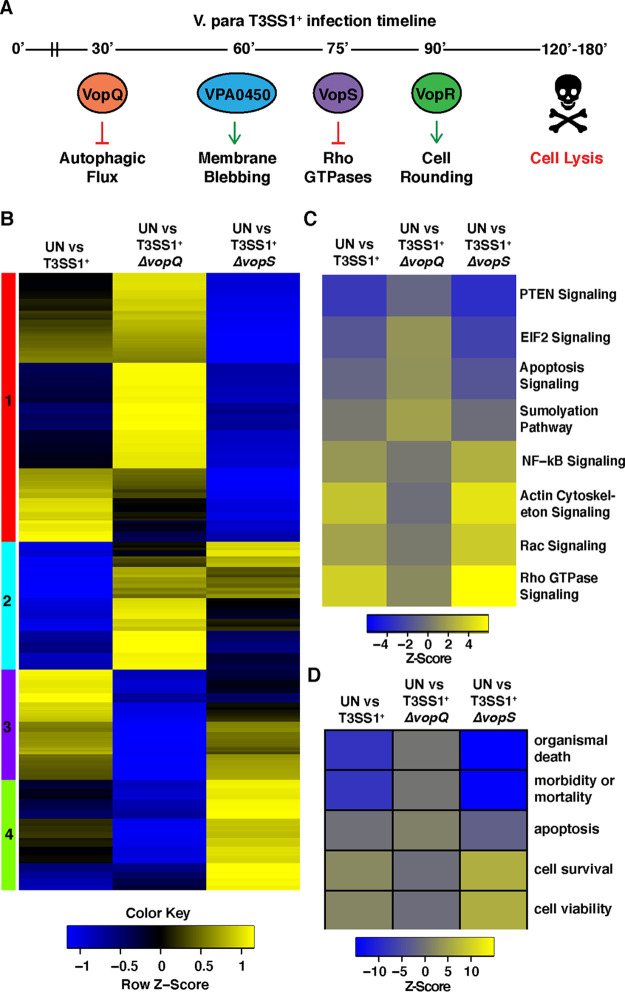
VopQ and VopS have antagonistic effect on T3SS1-specific pathway and network induction. (A) Illustration of temporal effector function during T3SS1-mediated cell death. (B) Heat map of normalized differential expression of previously identified T3SS1-specific transcripts in uninfected (UN) primary human fibroblasts compared to primary human fibroblasts infected with either V. parahaemolyticus T3SS1+, T3SS1+ΔvopQ, or T3SS1+ΔvopS for 90 min. Yellow denotes transcripts with relative increased abundance infected cells compared to UN cells, and blue denotes decreased abundance. Clusters (color bars on the left) were assigned through hierarchical clustering of the differential expression data. (C) Heat map of predicted repression (blue) and activation (yellow) Z-scores calculated from differential expression data for UN versus V. parahaemolyticus T3SS1+, UN versus V. parahaemolyticus T3SS1+ΔvopQ, and UN versus V. parahaemolyticus T3SS1+ΔvopS using Qiagen’s Ingenuity Pathway Analysis software. The color key correlates the displayed heat map color and calculated Z-scores, and gray denotes unaffected (P > 0.05) pathways. (D) Heat map of Ingenuity Pathway Analysis Z-score prediction of repression (blue) or activation (yellow) of biological networks after 90 min of POR3:T3SS1+, T3SS1+ΔvopQ, and T3SS1+ΔvopS infection.

