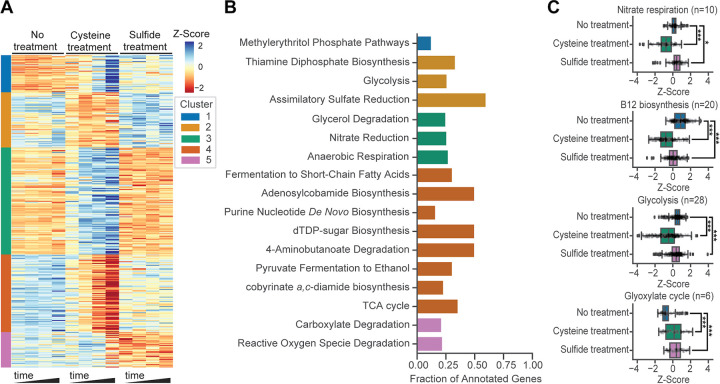
FIG 2.
I. calvum’s transcriptional responses to cysteine and sulfide treatment. (A) Differentially expressed genes (DEGs) clustered into five groups using k-means. Expression levels displayed were normalized using the Z-score. MetaCyc pathway terms enriched in each cluster (B) and average Z-score normalized expression of select pathways and processes (C). Bars indicate comparisons for which differences were significant. *, P < 0.05; ***, P < 0.001. Boxplots display estimates of data minimum (left whisker), median (line within box), maximum (right whisker), and interquartile range (box dimensions) as well as possible outliers (points beyond whiskers). Data are overlaid as scatter points.

