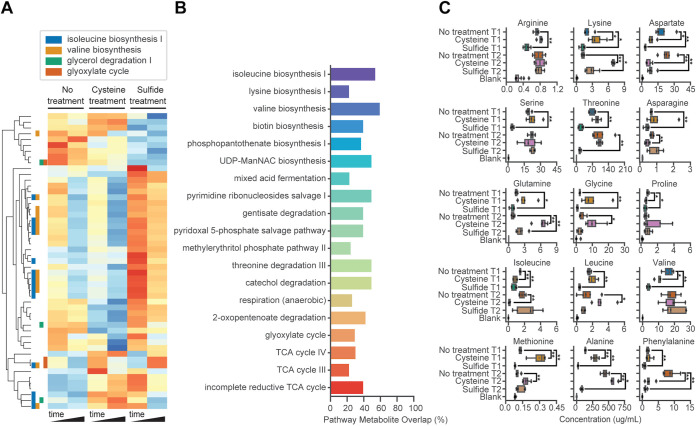
FIG 3.
Metabolome changes during physiological adaptation to cysteine and sulfide treatment. (A) Hierarchically clustered metabolomic feature abundances for those with putative identities scaled using natural logarithm and normalized with Z-score. (B) Pathways identified as significantly dysregulated in cysteine or sulfide treatment relative to no treatment based on enrichment of differentially abundant putative metabolites. (C) Concentrations of amino acids quantified using targeted metabolomics displayed. Bars indicate significance level of select comparisons. *, P < 0.05; **, P < 0.01. Boxplots display estimates of data minimum (left whisker), median (line within box), maximum (right whisker), and interquartile range (box dimensions) as well as possible outliers (points beyond whiskers). Data are overlaid as scatter points.

