
FIG 2.
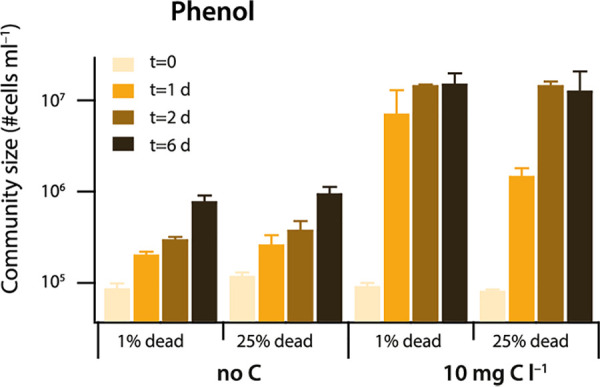
Effect of potential background growth on carbon released from dead cells. Bars show the mean community size (+1 SD) among four biological replicate assays sampled at the indicated time intervals, in presence or absence of added phenol (to 10 mg C · liter−1), and containing or not 25% dead (pasteurized) cells. Initial cell density, 105 cells · ml−1. Note that the community cell density is plotted on a log10 scale. Mean values at the same time points in the absence or presence of 25% dead cells are not statistically significantly different (P values > 0.05; two-tailed t test).