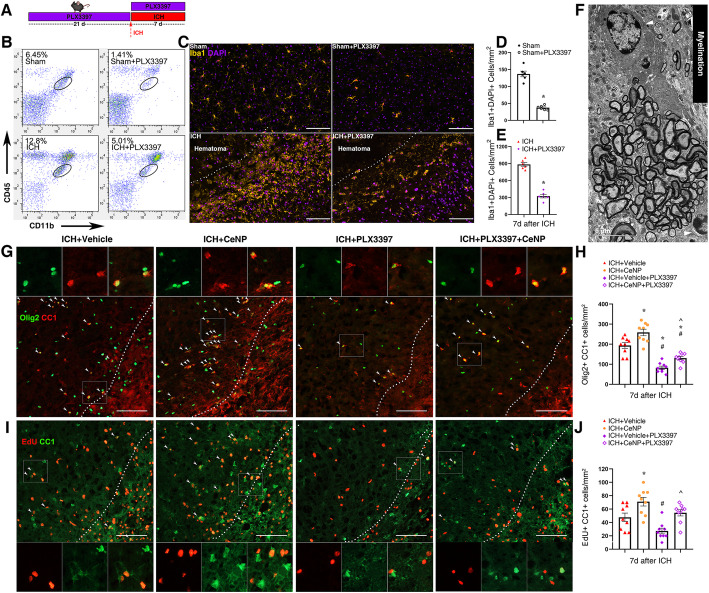
Fig. 6.
PEG-CeNP promoted OPCs differentiation/maturation partly in a microglia-dependent manner. a PLX3397 administration. b Representative flow cytometric dot-plot showed the percentage of microglia after PLX3397 administration in different groups. c Representative fluorescent images showed the expression of Iba1+ Cells after PLX3397 administration in striatum. Lens: × 200; Scale bar: 100 μm. d Quantification of Iba1+ Cells in Sham and Sham+PLX3397 group, n = 3/group, * p < 0.01 versus Sham. e Quantification of Iba1+ Cells in ICH and ICH + PLX3397 group, n = 3/group, * p < 0.01 versus ICH. f Representative TEM image of myelination showed the ultra-structures of oligodendrocyte (white arrows) and myelin sheath. Lens: × 7500; Scale bar: 5 μm. g Representative images of olig2 and CC1 double immunostaining at 7 days post ICH. Lens: × 200; Scale bar: 100 μm. h Quantification of CC1+olig2+ cells, n = 6/group, * p < 0.01 versus ICH + vehicle, # p < 0.01 versus ICH + CeNP, ^ p < 0.05 versus ICH + vehicle+PLX3397. i Representative images of EdU and CC1 double immunostaining at 7 days post ICH. Lens: × 200; Scale bar: 100 μm. j Quantification of EdU+ CC1+ cells, n = 6/group, * p < 0.05 versus ICH + vehicle, # p < 0.05 versus ICH + CeNP, ^ p < 0.05 versus ICH + vehicle+PLX3397

