
Extended Data Figure 8. Assessment of IAV infection in ADAMTS-4+/+ and ADAMTS-4−/− mice.
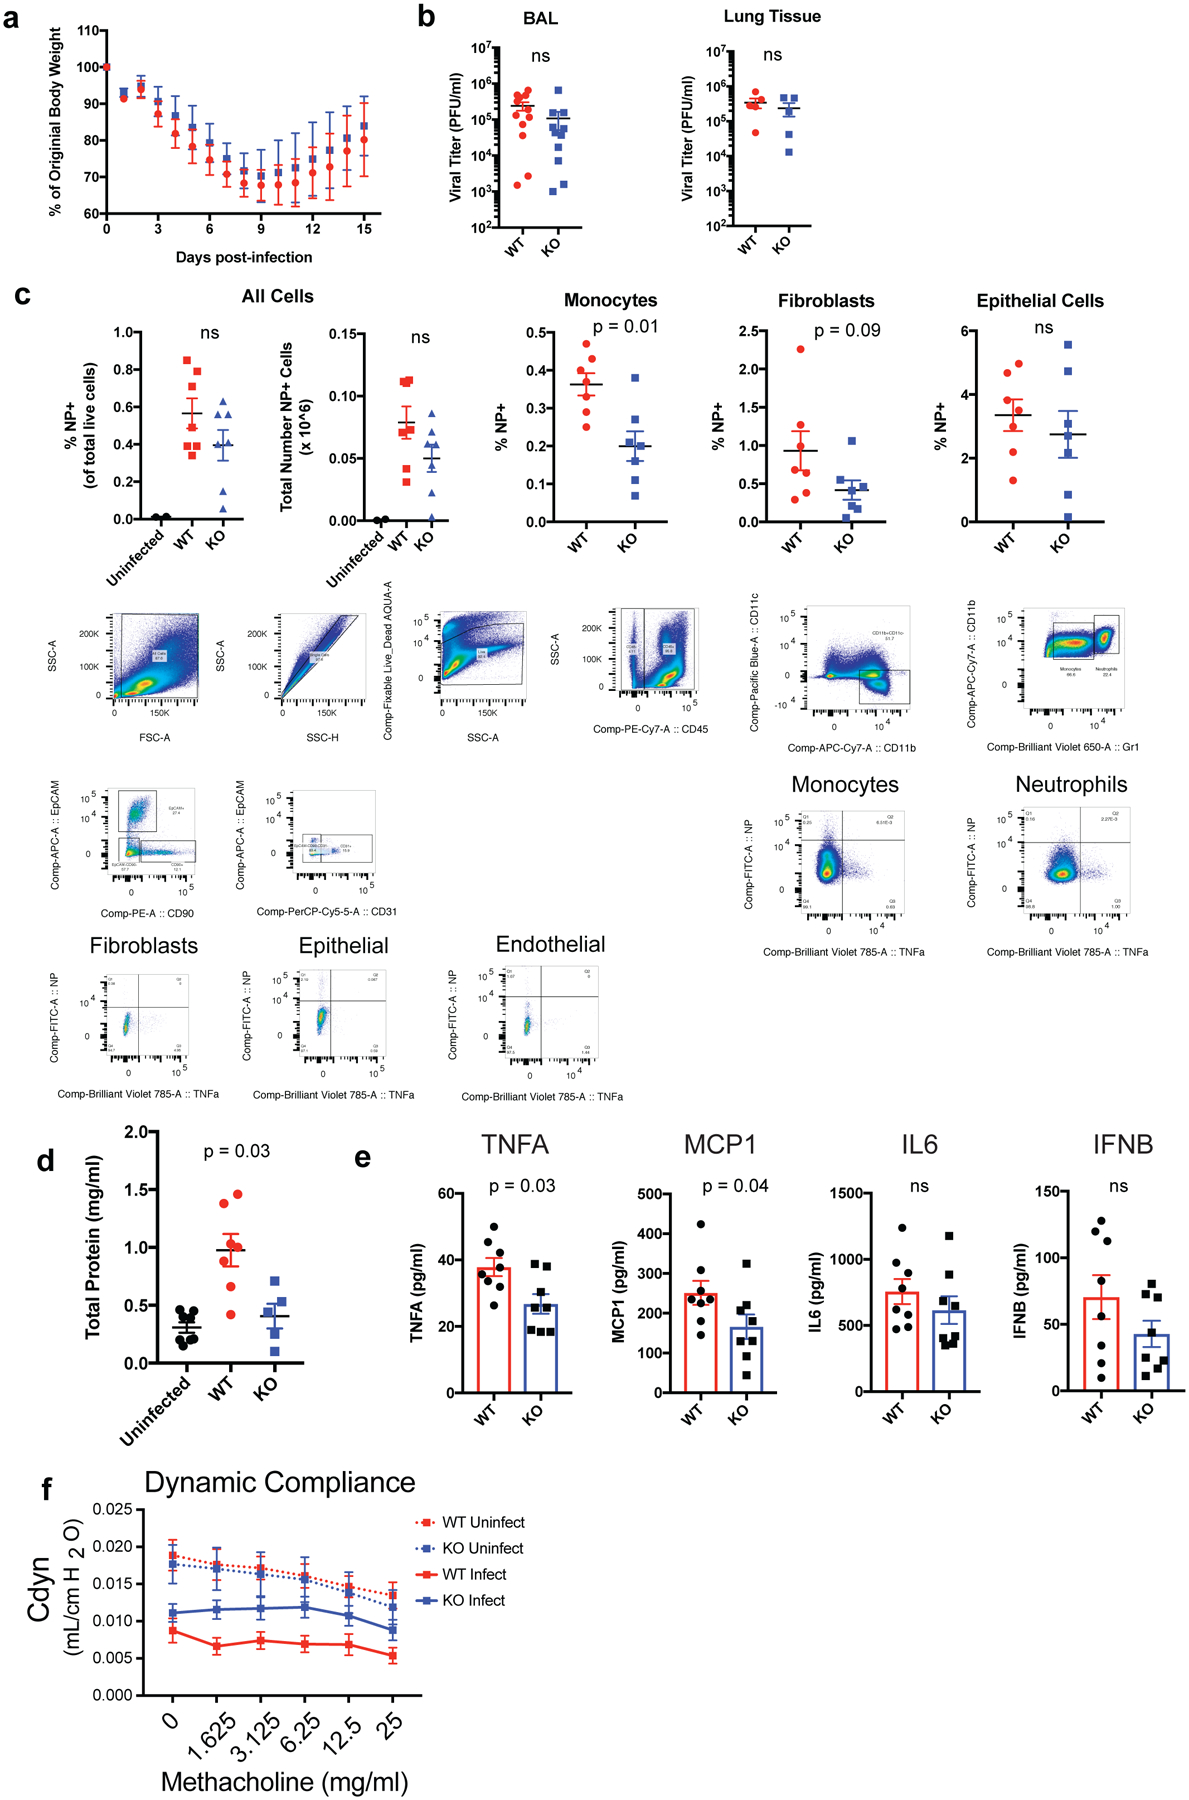
(A) Weight loss curves of ADAMTS-4+/+ and KO mice following lethal IAV challenge with 6000 EID50 PR8. Data points represent mean ± SD (WT, n = 27; KO, n = 16). Data are pooled from 5 independent experiments (B) Viral plaque titers in BAL fluid and lung tissue homogenates at 6 dpi. Each data point represents a biologically independent animal (BAL: WT, n = 12; KO, n = 11; Lung tissue: WT, n = 5; KO, n = 5). Groups were compared using a two-sided Mann-Whitney U test. Error bars represent standard error of the mean (SEM) (C) Cell-type specific infection based on IAV nucleoprotein (NP) positivity as assessed by flow cytometry and gating strategy for identifying populations for cell-type specific infection. Populations were identified using the following markers: Epithelial (CD45-Epcam+), Endothelial (CD45-CD31+), Fibroblasts (CD45-Epcam-CD90+), Monocytes (CD45+CD11c-CD11b+Gr-1lo), Neutrophils (CD45+CD11c-CD11b+Gr-1hi). Each data point represents a biologically independent animal (uninfected, n = 2; WT, n = 7; KO, n = 7). Groups were compared using a two-sided Mann-Whitney U test. Error bars represent SEM. (D) Total protein concentration in BAL fluid as measured by BCA assay at 6 dpi. Each data point represents a biologically independent animal (uninfected, n = 8; WT, n = 7; KO, n = 5). Groups were compared using a two-sided Mann-Whitney U test. Error bars represent SEM. (E) Cytokine concentrations in BAL fluid at 6 dpi as measured by multiplexed cytokine bead arrays (WT, n = 8; ADAMTS-4−/−, n = 8). (F) Measurement of dynamic lung compliance at 10 days after infection following sublethal challenge with IAV (Uninfected: WT, n = 8; KO = 3, Infected: WT n = 8, KO, n = 9). Error bars represent SEM. For statistical analysis, groups were compared using a two-sided Mann-Whitney U test.