
Extended Data Figure 1. Single-cell gene expression profiling of CD45-lung cells during severe influenza virus infection in mice.
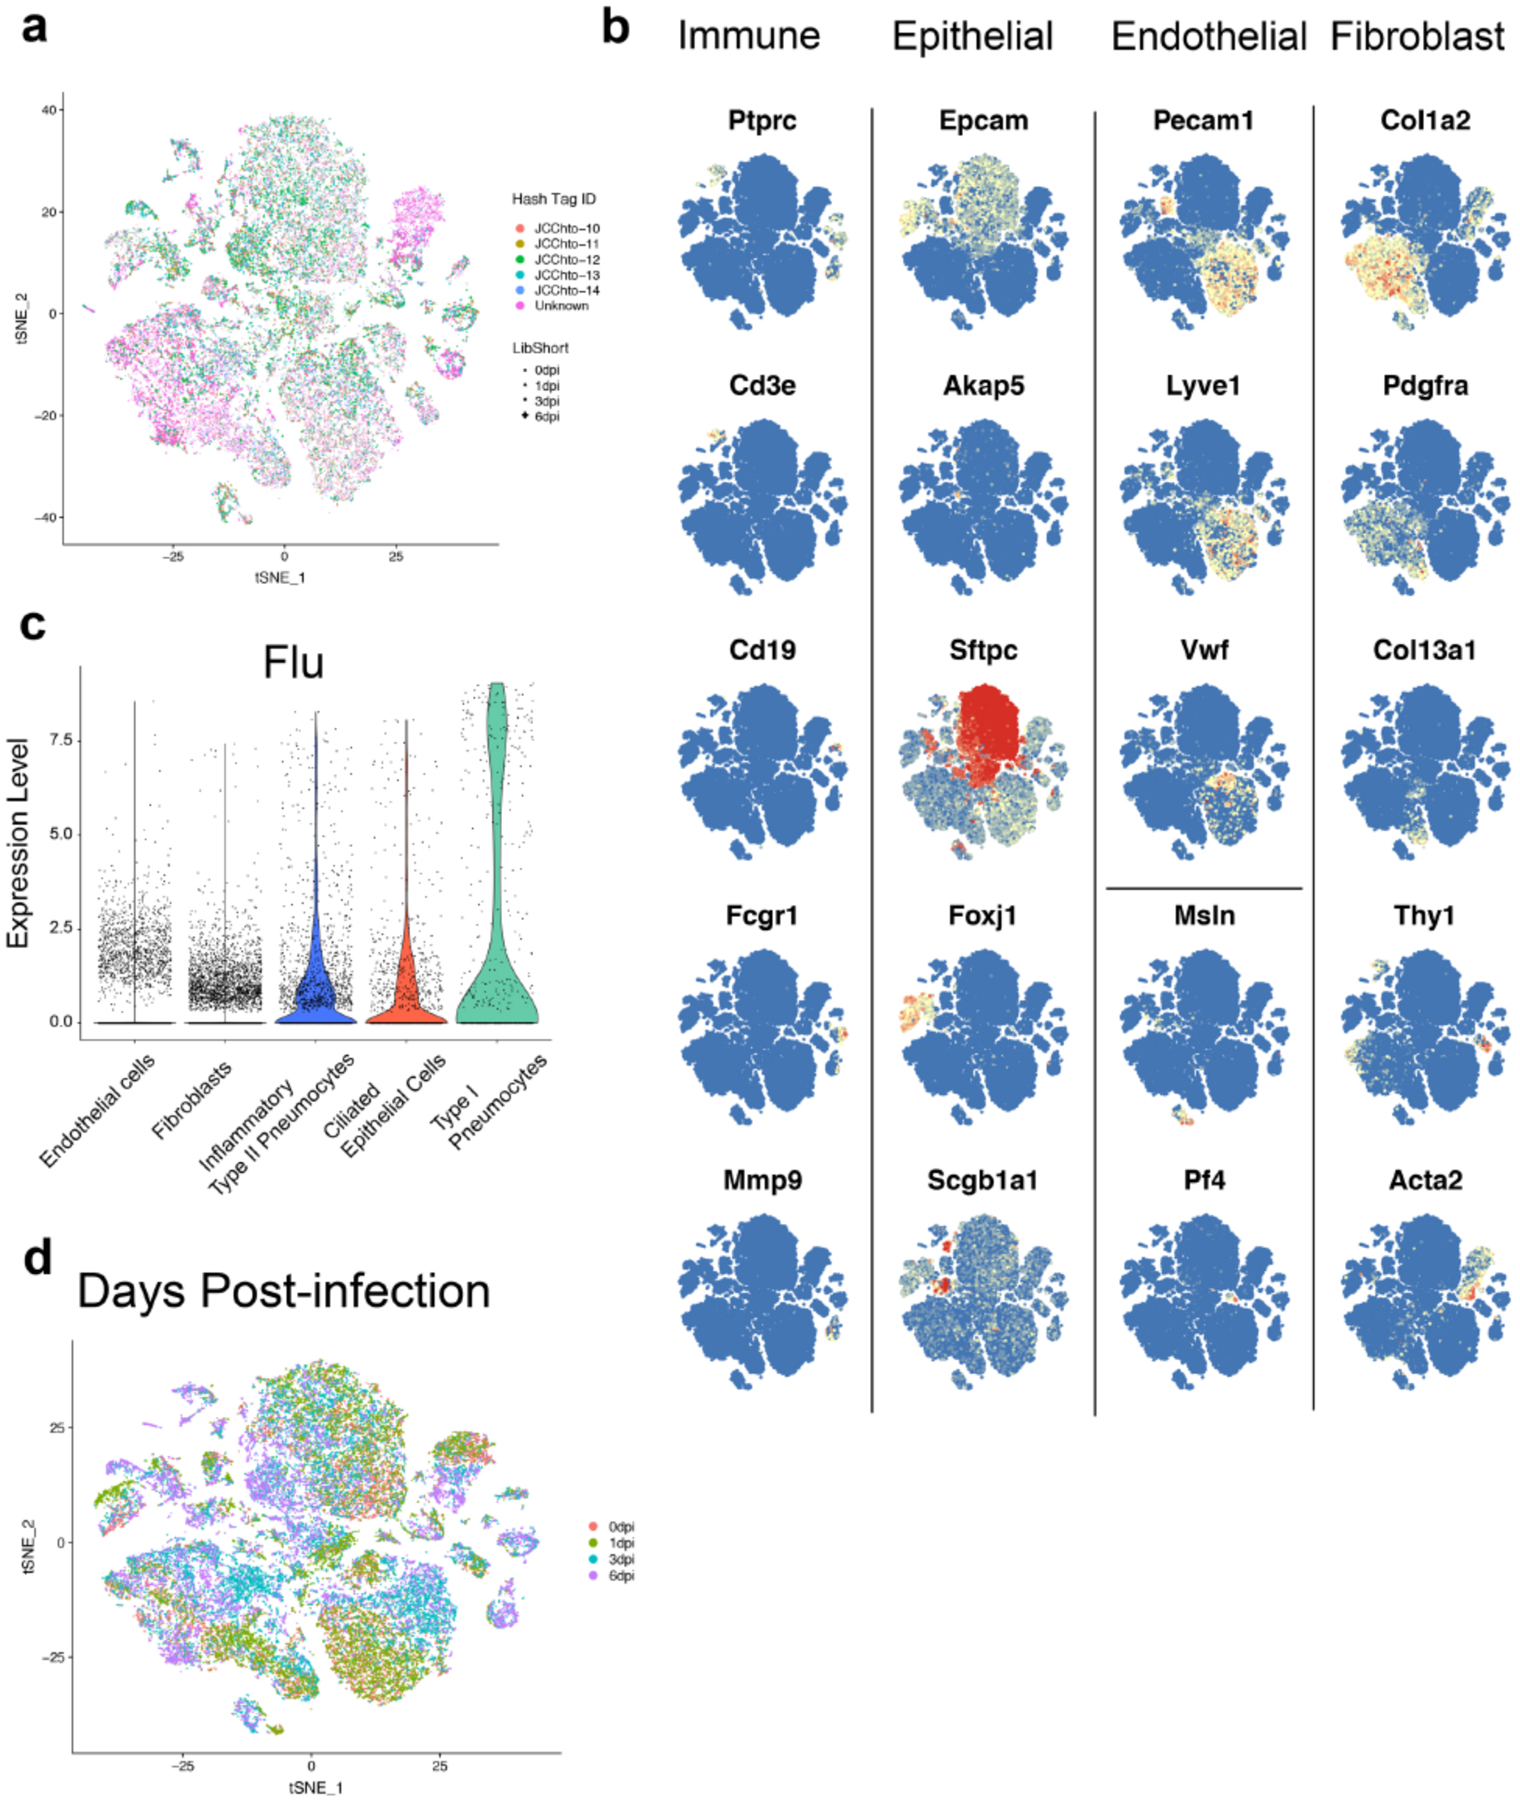
(A) Cell hashing of biological replicates for each time point. t-SNE of CD45-cells from mouse lungs at all time points. Cells from individual mice (n = 5 for time points 0, 1, and 3 dpi, and n = 4 for 6 dpi) were labeled with DNA-tagged antibodies (JCChto 10, 11, 12, 13, and 14) and pooled within time points. Pooled cells for each time point were run on separate 10x Genomics gel bead reactions. Cells are color-coded according to hashtag oligo ID as indicated at the right of the graph. ‘Unknown’ (purple) indicates that an insufficient number of hashtags were sequenced in order to determine the ID. Cells are also symbol-coded according to time point after infection: 0 dpi (circle), 1 dpi (triangle), 3 dpi (square), 6 dpi (cross). (B) Feature plots of signature genes used to identify mouse lung cell populations. The following genes were used to identify general populations of cells: immune cells (Ptprc), epithelial cells (Epcam), endothelial cells (Pecam1, Lyve1, Vwf), and mesenchymal cells (Col1a2). The following genes were used to identify specific cell populations within the main types of cells: T cells (Cd3e), B cells (Cd19), myeloid cells (Fcgr1), neutrophils (Mmp9), type I pneumocytes (Akap5), type II pneumocytes (Sftpc), ciliated epithelial cells (Foxj1), club cells (Scgb1a1), lymphatic endothelial cells (Pecam1, Thy1), fibroblasts (Pdgfra), pericytes and smooth muscle cells (Acta2), mesothelial cells (Msln), and platelets (Pf4). (C) Violin plot of expression of influenza A PR8 transcripts by scGEX in non-immune lung cells. (D) Overlay of days post-infection on t-SNE clustering of murine lung cells.