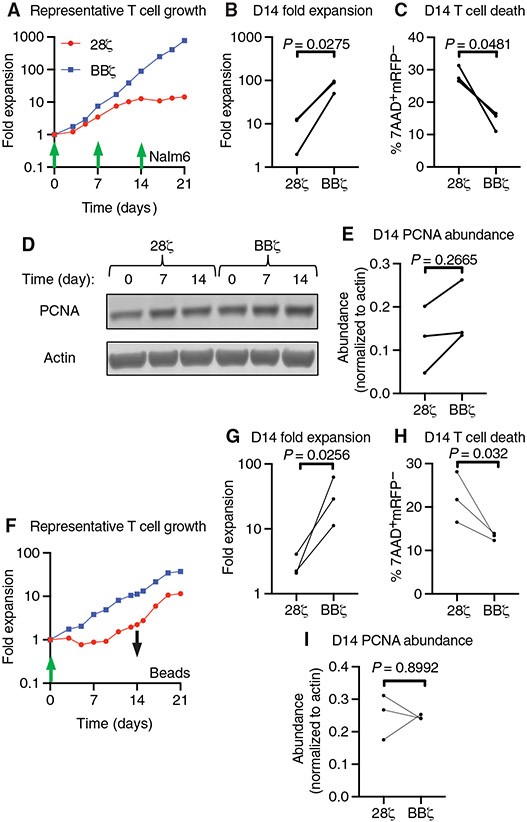
Fig. 1. 4-1BB–costimulated CAR activation drives greater ex vivo T cell expansion and survival than does CD28-costimulated CAR activation.
(A) Representative ex vivo expansion of the indicated CAR T cells stimulated by irradiated Nalm6 target cells at the indicated times at a T cell to target cell ratio of 2:1. (B) Quantification of T cell expansion after 14 days of ex vivo culture from the experiments represented in (A). (C) Quantification of cell death by measurement of the percentage of 7AAD+mCherry− cells in all events collected on day 14 of ex vivo culture from the experiments represented in (A). (D) Representative Western blotting analysis of PCNA abundance in the indicated CAR T cells at 0, 7, and 14 days of ex vivo culture with Nalm6 target cells. (E) Quantification of the relative amounts of PCNA in the indicated CAR T cells on day 14 of ex vivo culture with Nalm6 target cells. Data in (B), (C), and (E) are from three donors in two independent experiments and were analyzed by paired Student’s t test. (F) Representative ex vivo expansion of the indicated CAR T cells stimulated by anti-CD19 idiotype–coated target beads (at a T cell to bead ratio of 1:3) added at day 0 (green arrow) and removed at day 14 of culture (black arrow). (G) Quantification of T cell expansion after 14 days of ex vivo culture from the experiments represented in (F). (H) Quantification of cell death as assessed by measurement of the percentage of 7AAD+mCherry− cells in all events collected on day 14 of ex vivo culture from the experiments represented in (F). Data in (G) and (H) are from three donors in three independent experiments and were analyzed by paired Student’s t test. (I) Quantification of the relative abundance of PCNA as assessed by Western blotting analysis of the indicated CAR T cells on days 0, 7, and 14 of ex vivo culture with target beads. Data are from donors in three independent experiments and were analyzed by paired Student’s t test.

