
FIGURE 1.
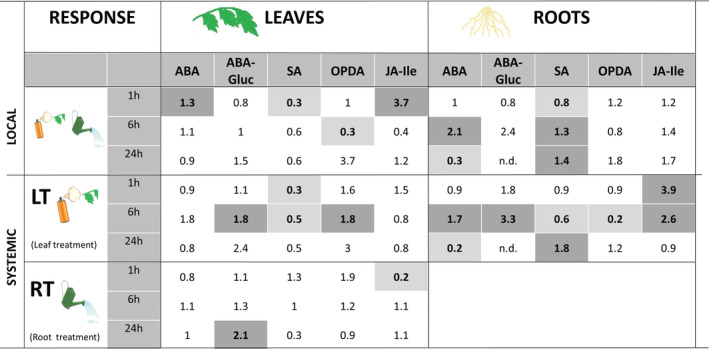
Time course analysis of local and systemic changes in hormonal levels upon OG treatment in leaves or roots of tomato plants. Hormonal levels were quantified by UPLC‐MS/MS at 1, 6 and 24 hr in tomato plants elicited with OGs solution of 50 μg/ml. For leaf treatments (LT), the fourth true leaf was sprayed with the OGs solution and samples from the treated leaf (local response‐leaves‐), upper leaf and roots (systemic response) were harvested at the different time points. For root treatments (RT) the OG solution was applied to roots and samples at the different time points were taken from roots (local response‐roots‐) and in the upper leaves for systemic responses (Systemic, RT). Hormone contents are shown in Figure S2a–c. Here, numbers represent fold induction in the hormone levels of treated vs control plants. Bold numbers indicate significant differences (t‐test; p‐value < .05; n = 6). Dark shading cells highlight significantly over accumulated compounds and, light shading cells highlight compounds that are significantly less accumulated