
FIGURE 6.
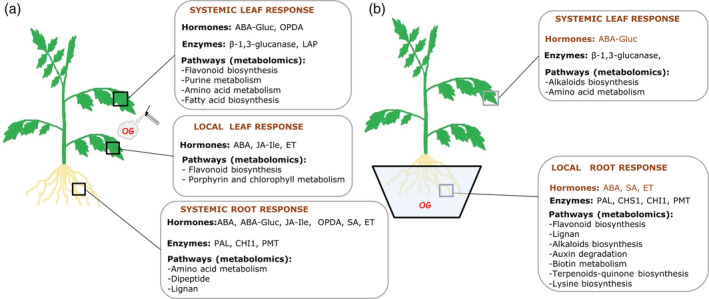
Summary of the responses activated in tomato leaves and roots upon OG treatments. The model displays local and systemic tomato responses at the hormonal, enzymatic and metabolomic level depending on the organ of the perception. (a) Plant responses to OG treatment in leaves. Local responses in treated leaves and systemic responses in leaves and roots are shown. (b) Plant responses to OG application in roots. Local responses in roots and systemic response in leaves are shown