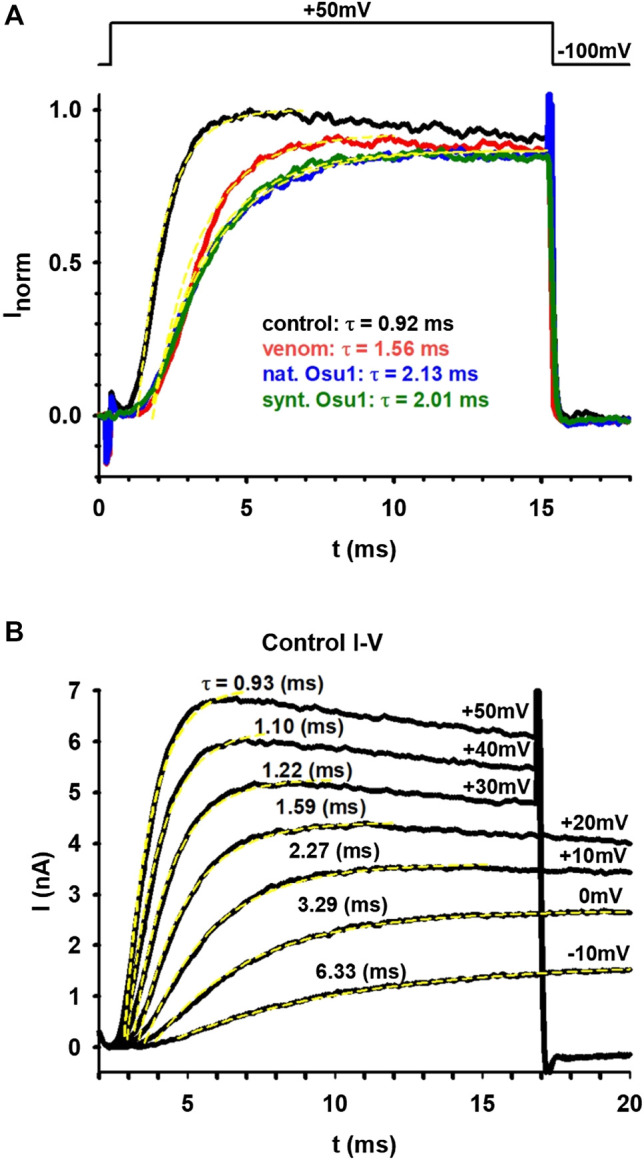
FIGURE 2.

Oculicosa supermirabilis venom and fraction #59 modifies hKv1.5 currents expressed in MEL cells. (A) shows the current traces recorded under normal conditions (black), in the presence of complete venom (10 µg/ml; red), with fraction #59 or Osu1 (6.5 µg/ml, ∼0.9 µM; blue) and recombinant rOsu1 (3 µM; green). The voltage protocol is shown above the figure. The current traces were fitted with a single-exponential function (yellow dashed lines), and the tau values for each trace are indicated with the appropriate color coding. (B) displays I-V curves where the ionic currents were recorded under normal conditions and were evoked from −100 mV holding potential to different depolarizing potentials: from −10 mV up to +50 mV. The appropriate membrane potential values are indicated next to the traces along with the tau values coming from a single-exponential fitting.
