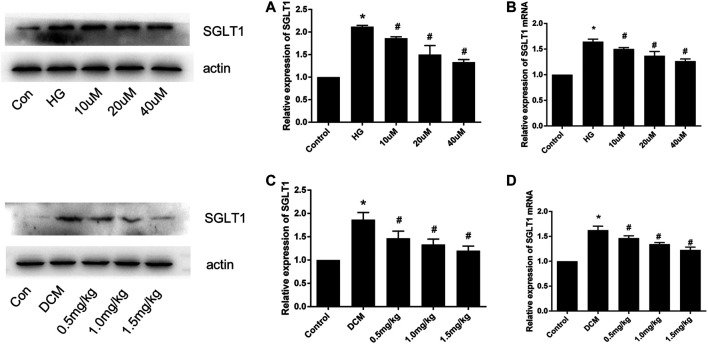
FIGURE 5.
SGLT1 expression in H9C2 cells and diabetic rats (n = 10). (A) Western blot and (B) RT-PCR analyses of SGLT1 protein in H9C2 cells. (C) Western blot and (D) RT-PCR analyses of SGLT1 in tissues. *p < 0.05 compared with the control group; # p < 0.05 compared with the DCM group. Experiments were performed in triplicate.

