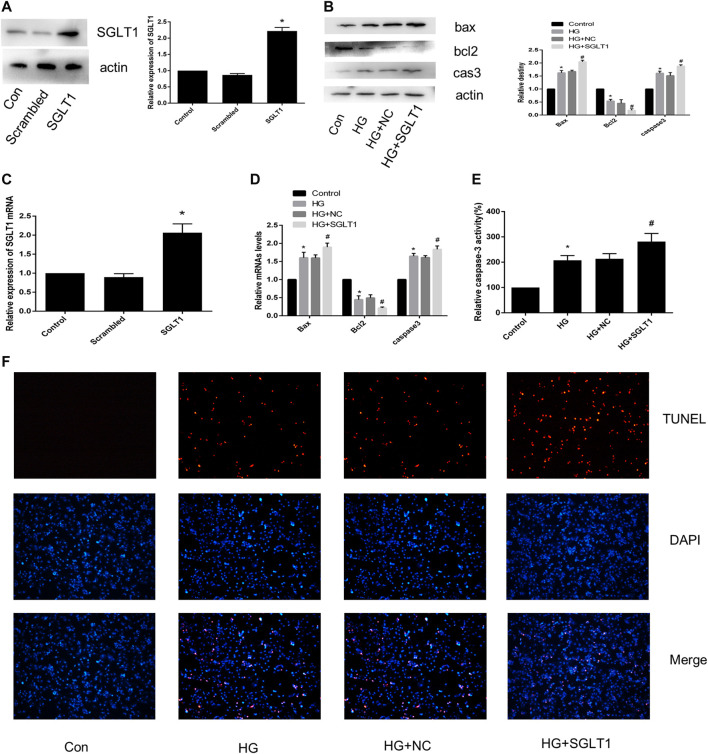
FIGURE 7.
SGLT1 upregulation aggravated apoptosis induced by HG. (A) SGLT1 protein expression following successful transfection of SGLT1 into H9C2 cells. (B) RT-PCR analysis of SGLT1. (C) The expression of apoptosis-related specific markers (bax, bcl2, caspase-3). (D) Relative mRNA levels of bax, bcl2, and caspase-3. (E) Caspase-3 activity in H9C2 cells. (F) Apoptotic rate of H9C2 cells measured by TUNEL staining. *p < 0.05 compared with the control group; # p < 0.05 compared with HG group. Experiments were performed in triplicate.

