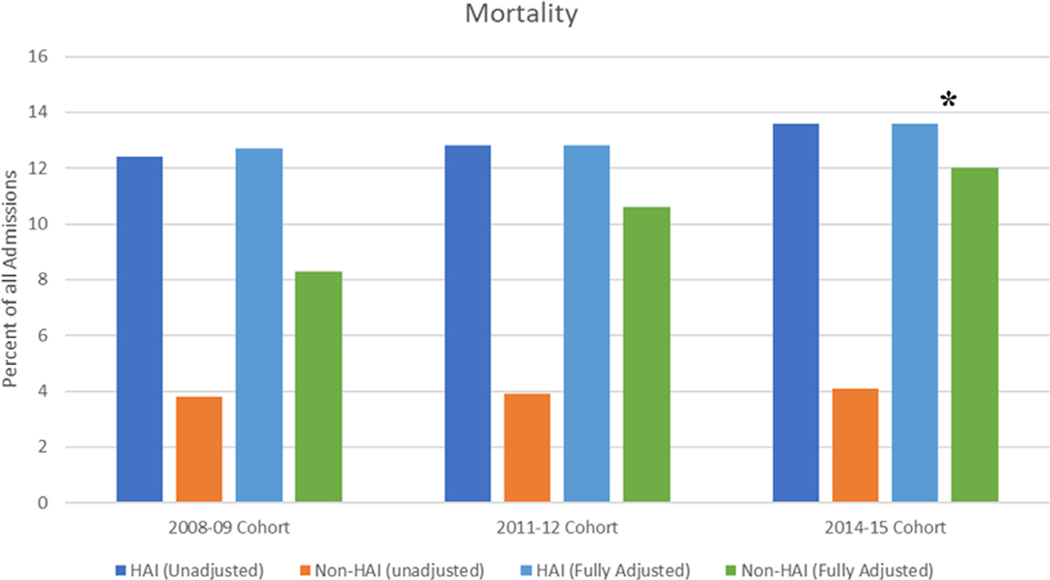
Figure 3.
In-hospital mortality in our unadjusted and fully propensity/risk adjusted model for 3 different time periods
All p values <0.0001 except * = 0.001, odds ratio (confidence interval) for adjusted models 2008 to 2009 cohort, 2011 to 2012 cohort, and 2014 to 2015 cohort 1.6 (1.4 to 1.8), 1.2 (1.1 to 1.3), and 1.2 (1.1 to 1.3), respectively.

