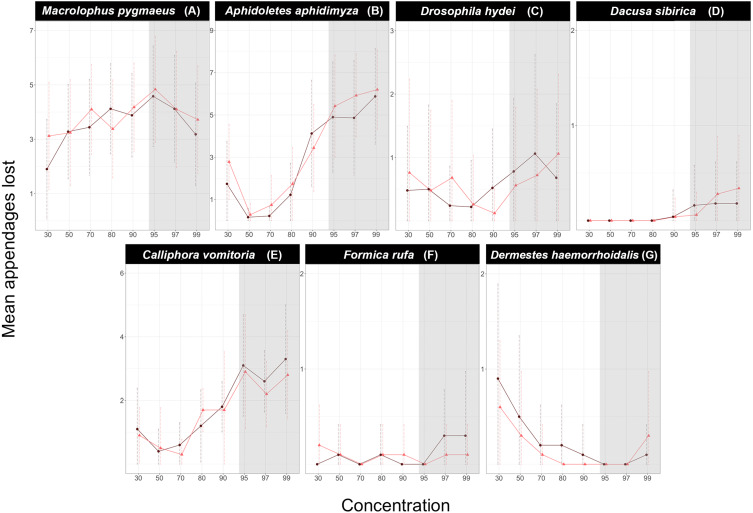
Figure 2. Effect of ethanol concentration on the number of appendages lost by each species.
(A) Macrolophus pygmaeus, (B) Aphidoletes aphidimyza, (C) Drosophila hydei, (D) Dacusa sibrica, (E) Calliphora vomitoria, (F) Formica rufa, (G) Dermestes haemorrhoidalis. Dark purple circles represent the Gentle shaking regime while bright red triangles represent the Vigorous regime. The shadowed area corresponds to the ethanol concentrations in which DNA is optimally preserved according to literature.

