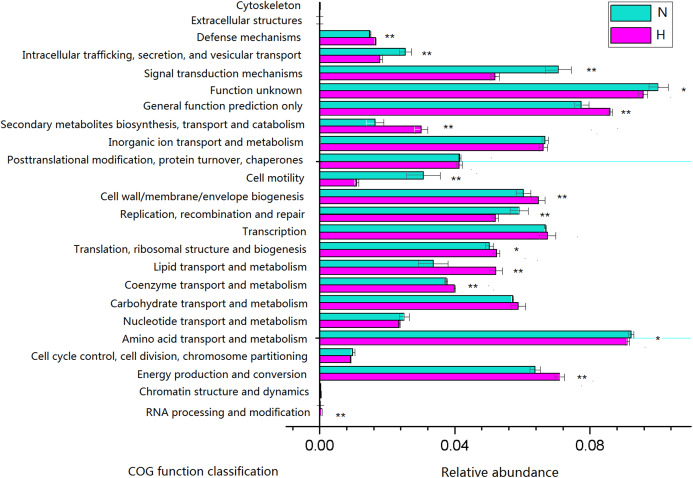
Figure 6. Predictive functional profiles generated from 16S rRNA gene sequences using PICRUSt.
Significant differences between HV and NHV snails were observed for several COG function (two-tailed Student’s t-test ; *P < 0.05, **P < 0.01). The HV group is represented by green bars (H) and the NHV group by red bars (N).

