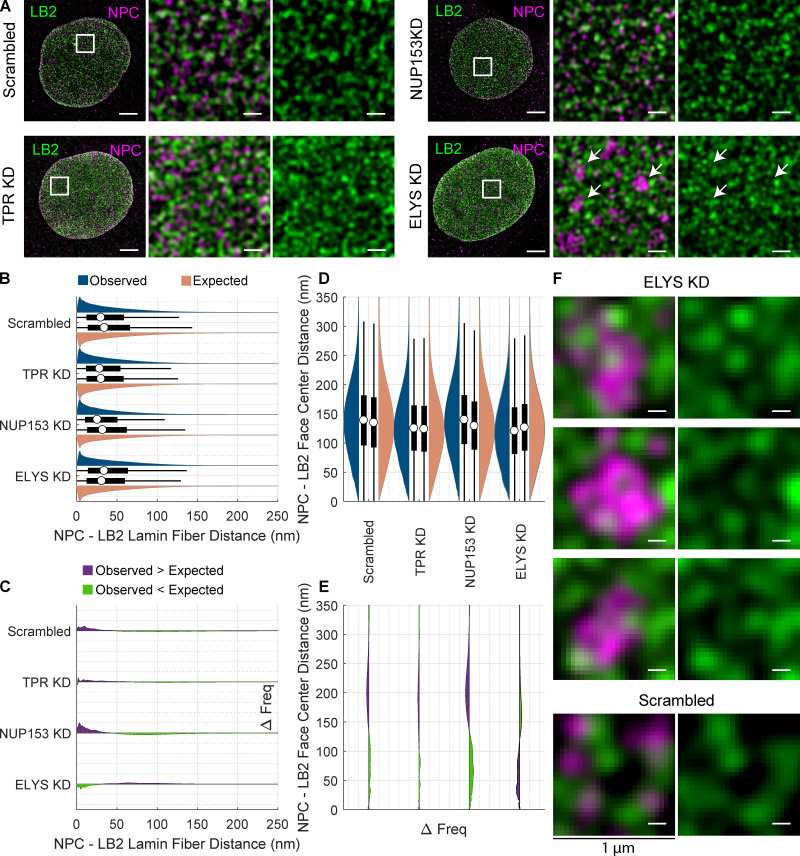
Figure 8.
Co-distribution of LB2 and NPCs after siRNA transfection does not show enlarged faces around NPC clusters upon ELYS KD. (A) Immunofluorescence images of LB2 (green) and NPCs (magenta) following KDs of TPR, NUP153, ELYS, and scramble control. Area of white box (left) is shown merged (center) and just lamin (right). White arrows indicate areas of NPC clustering. Scale bar = 5 µm (full), 625 nm (inset). (B) Paired violin and box plots of NPC center to LB2 fiber center distances. The violin (blue) and box plots on top represent the observed distance distributions. The violin (red) and box plots on bottom represent the expected distance distributions under the null hypothesis. The white circle indicates the median. The thick black bar indicates the interquartile range (IQR). The black whiskers indicate 1.5 times the IQR. (C) Frequency (Freq) difference plot of observed minus expected LB2 fiber center to NPC center distances. The green portion below the line indicates where the observed frequency is less than expected. The purple portion above the line indicates where the observed frequency is greater than expected. (D) NPC center to LB2 face center distances displayed as in B, rotated 90° counterclockwise. (E) Frequency difference plot of NPC to LB2 face center distances, displayed as in C, rotated 90° counterclockwise. (F) 1-µm2 areas around NPC clusters formed after scramble treatment or ELYS KD indicated by white arrows in A shown merged (left) and just lamin (right). Each violin or box plot represents 20 cells with the number of NPCs detailed in Table 3. Scale bar = 150 nm.

