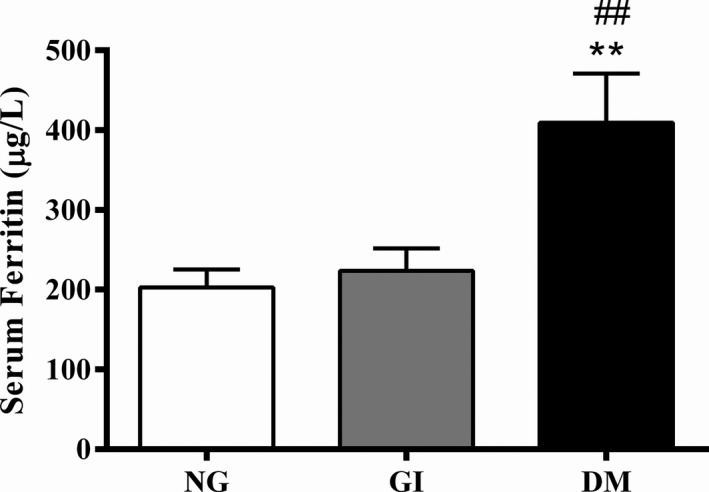
FIGURE 3.

Serum ferritin levels. NG: normal glucose; GI: glucose intolerant; DM: newly diagnosed diabetes. N = 20–22 per group. The data were presented as means ± SEM and were analyzed by one‐way ANOVA and Tukey's post hoc test. **p < .01 compared with NG; ##p < .01 compared with GI
