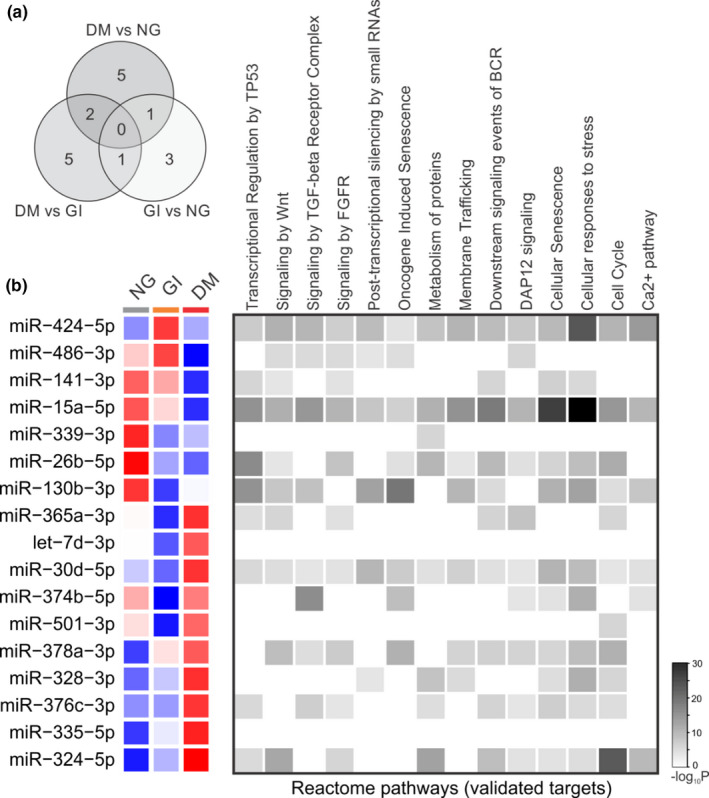
FIGURE 4.

Profiling plasma‐derived microvesicle microRNAs in the three groups. (a) The Venn diagram indicates the number of differentially expressed microRNAs in each pairwise comparison. (b) Heat‐map with the fold change over the normal glucose group for the 17 miRNAs expressed in all groups. The color scale illustrates the row‐wise z‐score expression by microRNA; red and blue represent over and under mean expression, respectively. Each square represents the group means. The left square represents differentially expressed microRNAs enriched in the Reactome pathway target. NG, normal glucose (n = 15); GI, glucose intolerant (n = 15); DM, newly diagnosed diabetes mellitus (n = 15)
