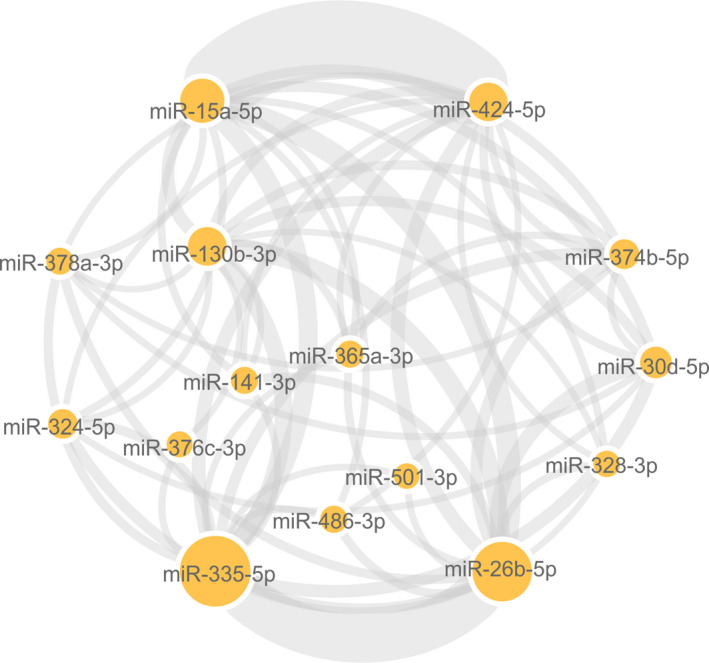
FIGURE 6.

Regulatory network of diabetes‐associated genes and their target miRNAs. Cytoscape software was used to analyze a list containing 17 differentially expressed miRNAs capable of separating subjects with newly diagnosed diabetes mellitus from those with glucose intolerance and normal glucose based on their respective fold change and p values. Circle nodes represent differentially expressed miRNAs. A minimum of 10 targets forms the lines connecting the miRNAs, and the thickness and the size of the nodes are directly proportional to the number of targets. miR, microRNA
