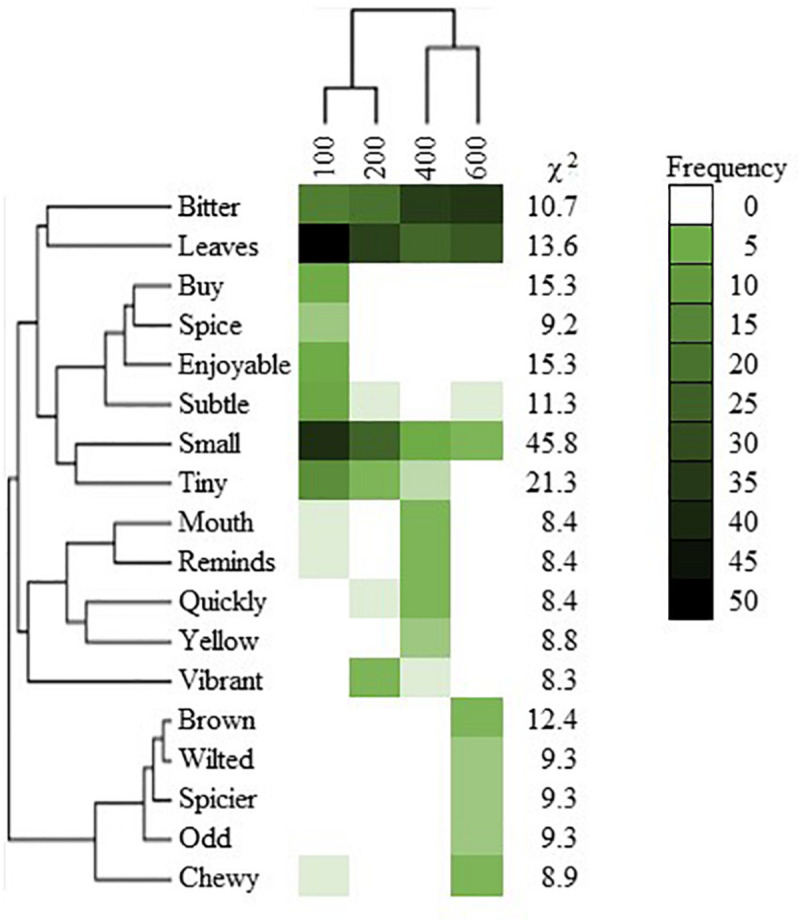
FIGURE 7.

Frequency heat map of words used to describe sweet basil “Nufar” (Ocimum basilicum) grown under radiation intensities of 100, 200, 400, or 600 μmol ⋅ m–2 ⋅ s–1 photosynthetic photon flux density (PPFD). χ2 describes the goodness of fit; phylogenetic trees depict the cluster analysis relationship between words used and the relationship between words used and samples. All words reported exhibited differences P < 0.05 based on 90 respondents.
