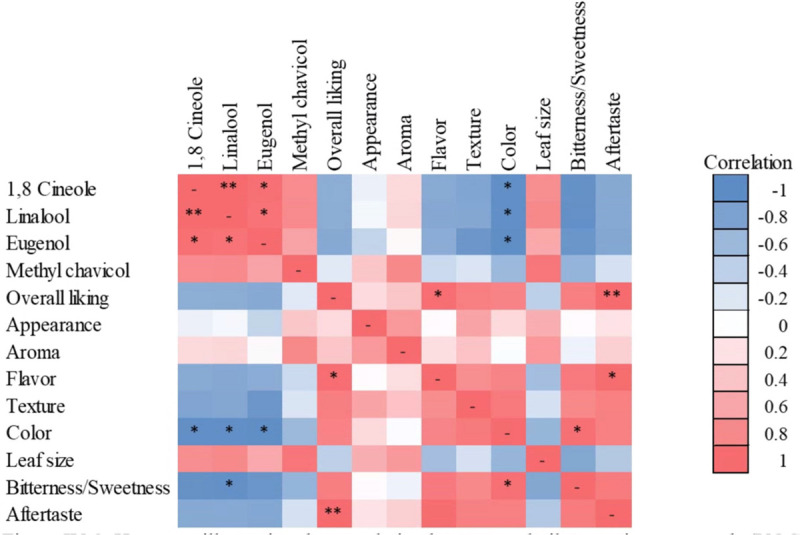
FIGURE 9.

Heat map illustrating the correlation between volatile organic compounds (VOCs) and sensory preference characteristics of sweet basil “Nufar” (Ocimum basilicum) grown under radiation intensities of 100, 200, 400, or 600 μmol ⋅ m–2 ⋅ s–1 photosynthetic photon flux density (PPFD). Blue and red represent negative and positive correlations, respectively. Asterisks indicate significant correlations based on Pearson correlation *P < 0.05; **P < 0.01.
