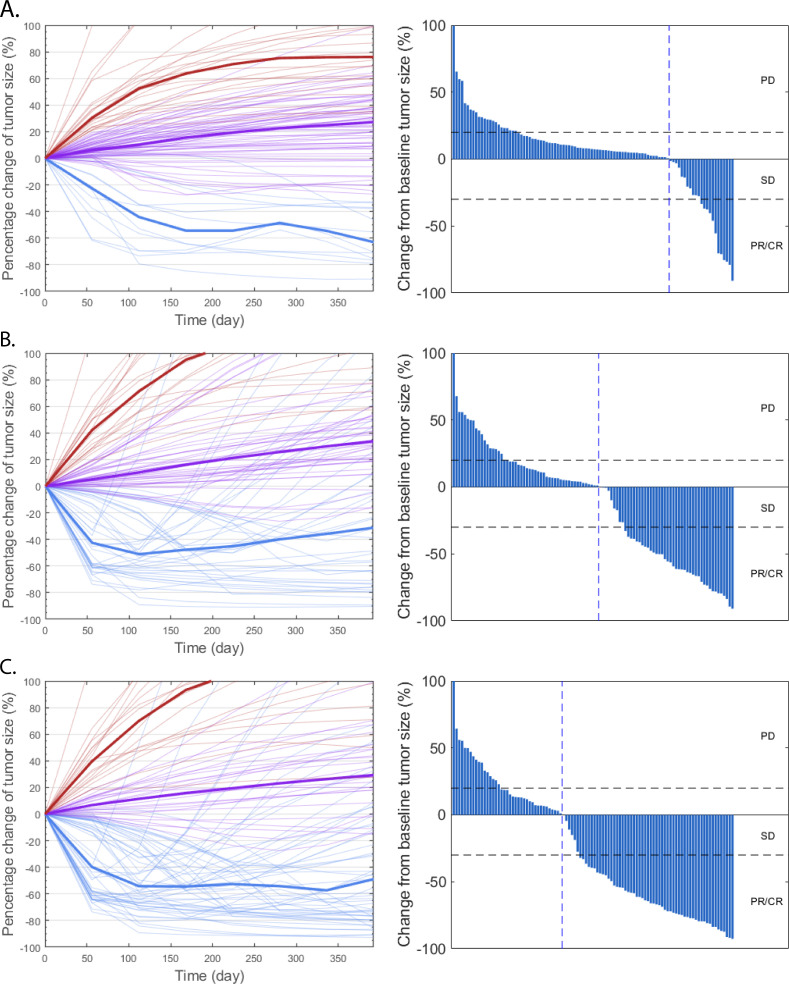
Figure 2.
Rate of response (left) and the best overall response (right) in model-predicted tumor diameter of 100 randomly selected virtual patients. Response is assessed by RECIST V.1.131 in atezolizumab monotherapy (A), nab-paclitaxel group (B), and atezolizumab+nab-paclitaxel group (C). Median (thick lines) and individual (thin line) rate of response are shown in PD (red), SD (purple), and PR/CR (blue) subgroups. CR, complete response; nab, nanoparticle albumin-bound; PD, progressive disease; PR, partial response; SD, stable disease.

